Rates rose on Friday to their highest level in some time, with the 10-year closing around 97 bps. It doesn’t sound like much, but consider that the 10-year rate was at 50 bps on August 4, and you can quickly realize that is a pretty big move. Rates could be heading even higher, with stimulus likely coming soon.
The 10-year yield recently broke a downtrend that has been in place since late 2018. It now has its sites on a resistance level around 1.25%, again a very low level based on historical trends. Still, when equity prices have adjusted for these low rates, even the slightest move higher from here could easily disrupt the rally.
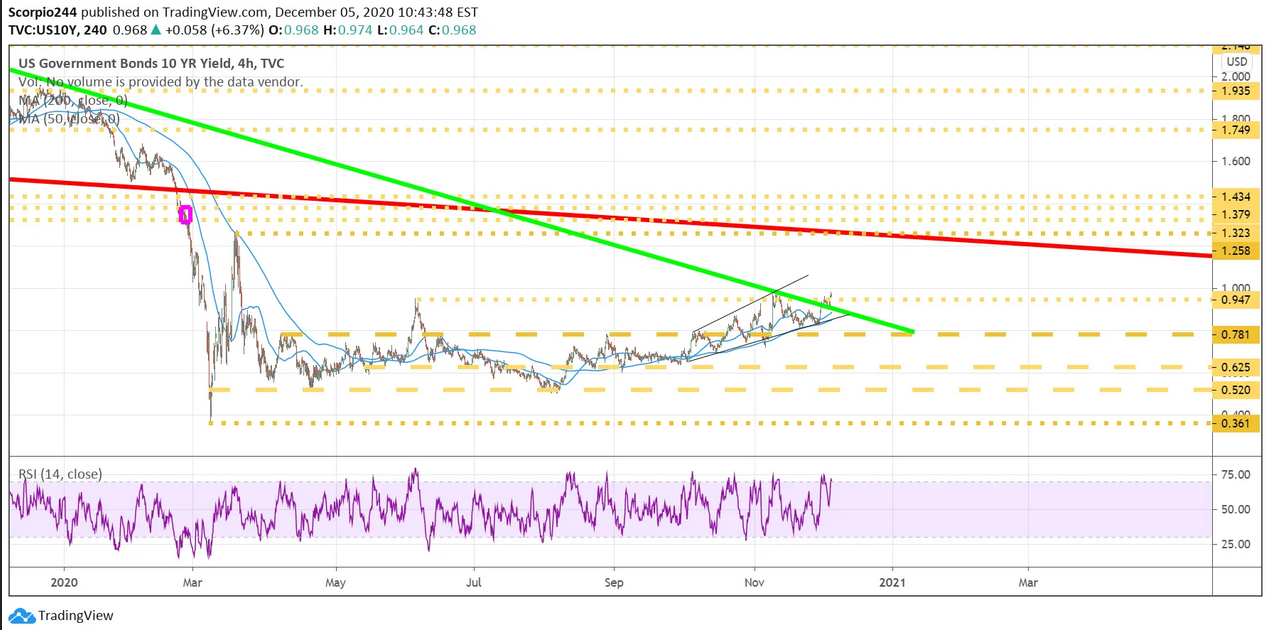
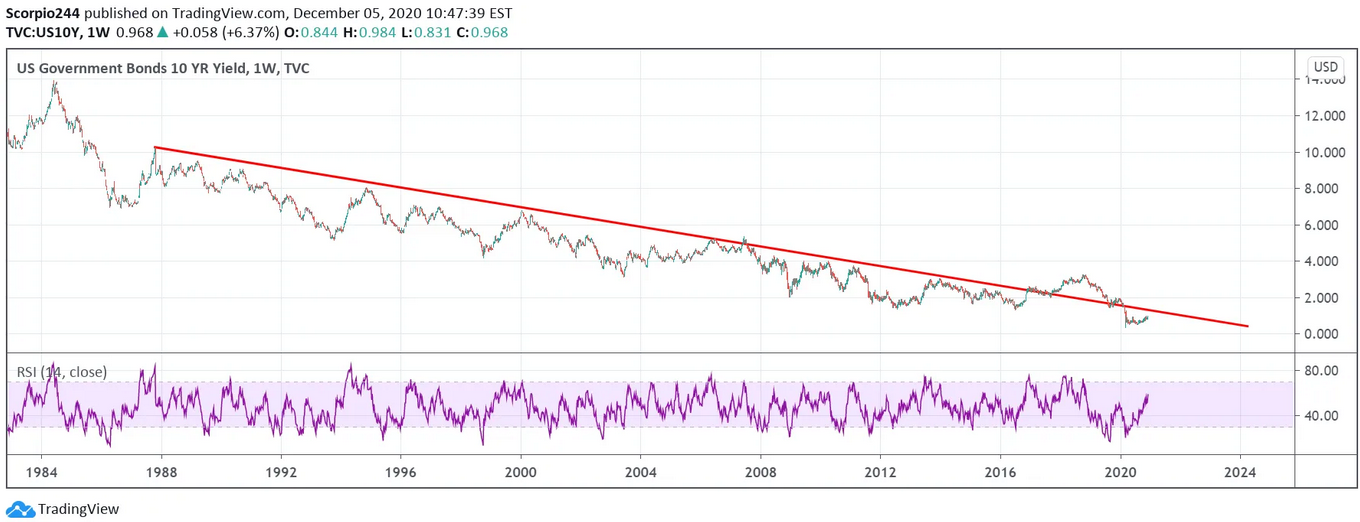
The red line in the chart above and below represents a multi-decade downtrend that has been present in the 10-year rate since 1988. What happens when we reach that trend line is a story for another day.
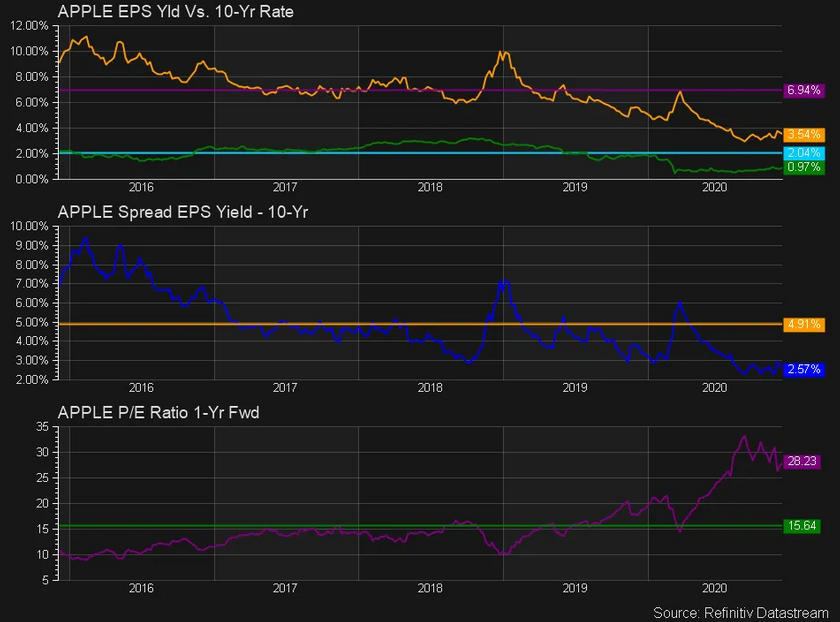
The big problem is that many stocks have seen their stock prices soar on low rates, dragging their cash flow and earnings yields down to account for the low rate environment. It means that as rates on Treasuries rise, the earnings and cash flow yields for some of these big long-term growth stocks will need to adjust higher as well, which means a lower stock price.
The earnings yield is simply the earnings or earning estimates divided by the stock price. Essentially the inverse of the P/E ratio, another reason we have seen PE ratio soar across the spectrum of equities.
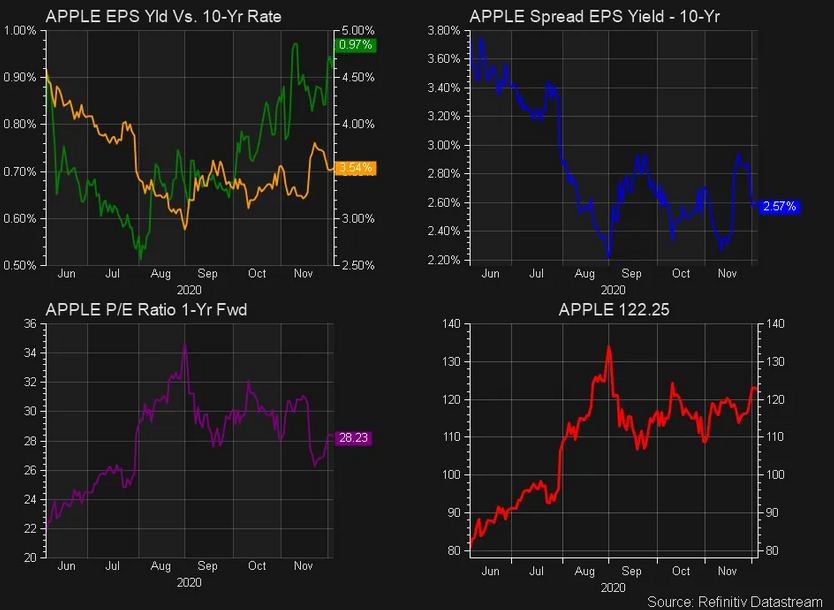
Apple (NASDAQ:AAPL) is just one example, with its earnings yield falling to 3.54% this year, its lowest level in years. It simply means that its PE ratio has risen to its highest level in years. The 10-year plunging has driven the move lower in the earnings yield.
In the middle pane, we can see that the spread or the difference between the 10-year rate and Apple’s earnings yield has fallen to 2.57%, its lowest level since late 2015. However, to keep that spread constant, to adjust for rising rates, the stock price will need to fall, or earnings growth will need to accelerate.
Apple’s stock peaks on September 2 and the 10-year has been trending higher since. Notice Apple’s stock hasn’t advanced; it has been essentially trending sideways.
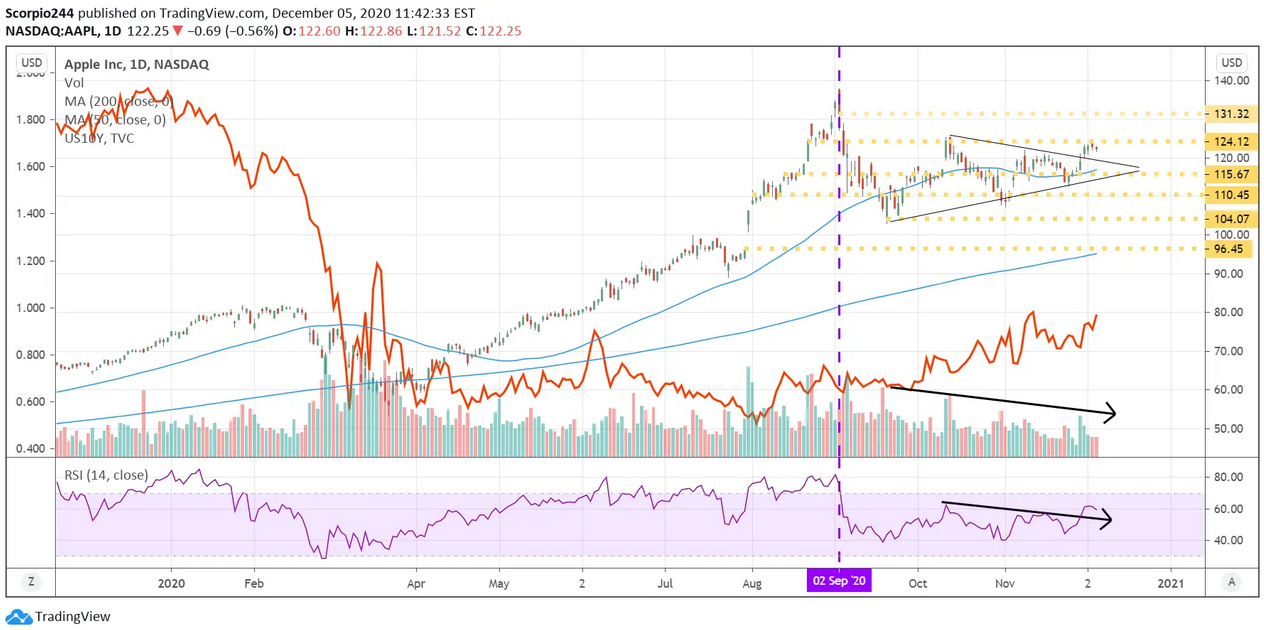
Meanwhile, notice that in recent days, the spread between Apple’s earnings yield and the 10-year has contracted some, as the price of the stock has risen. But if the yields continue to rise, for that earnings yield to rise, the price of Apple’s stock will need to fall to keep the spread constant; otherwise, the spread will need to contract further, which is possible.
Amazon’s is more of a free-cash-flow yield story since earnings are anything but predictable for the company. The free cash flow yield has also followed the plunging rate on the 10-year.
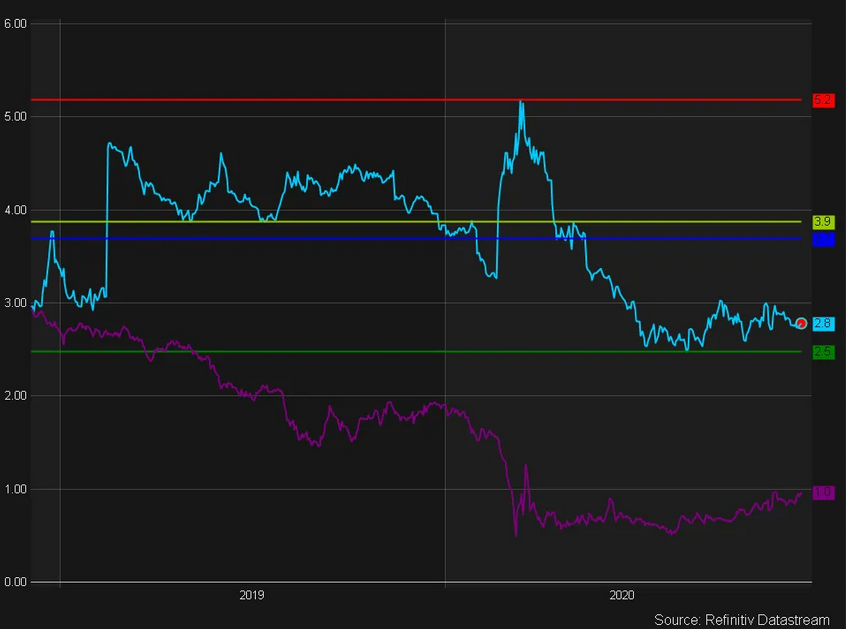
Again, as rates rise, that free cash flow yield is likely to rise as well, which will be reflected by the price of the stock falling.
So it makes paying attention to the 10-year rate perhaps more important than ever.
