Get 40% Off
🤯 Perficient is up a mind-blowing 53%. Our ProPicks AI saw the buying opportunity in March.Read full update

Qualcomm’s Recovery Might Not Last Long

Published 06/05/2017, 05:17 AM

Shares of Qualcomm (NASDAQ:QCOM) Inc., the San Diego, California-based chip-maker, have been on a tear since late-April, when the price touched $51.06. A little over a month later, the stock closed the last trading session at $58.58, representing a recovery of 14.7%. Many might see this rally as an invitation to grab shares in one of the largest semiconductors and telecommunications companies in the world.

Elliott Wave analysts, on the other hand, need to examine the price action prior to the current jump and see how it fits into the bigger picture. The 4-hour chart of Qualcomm below will help us with this task.
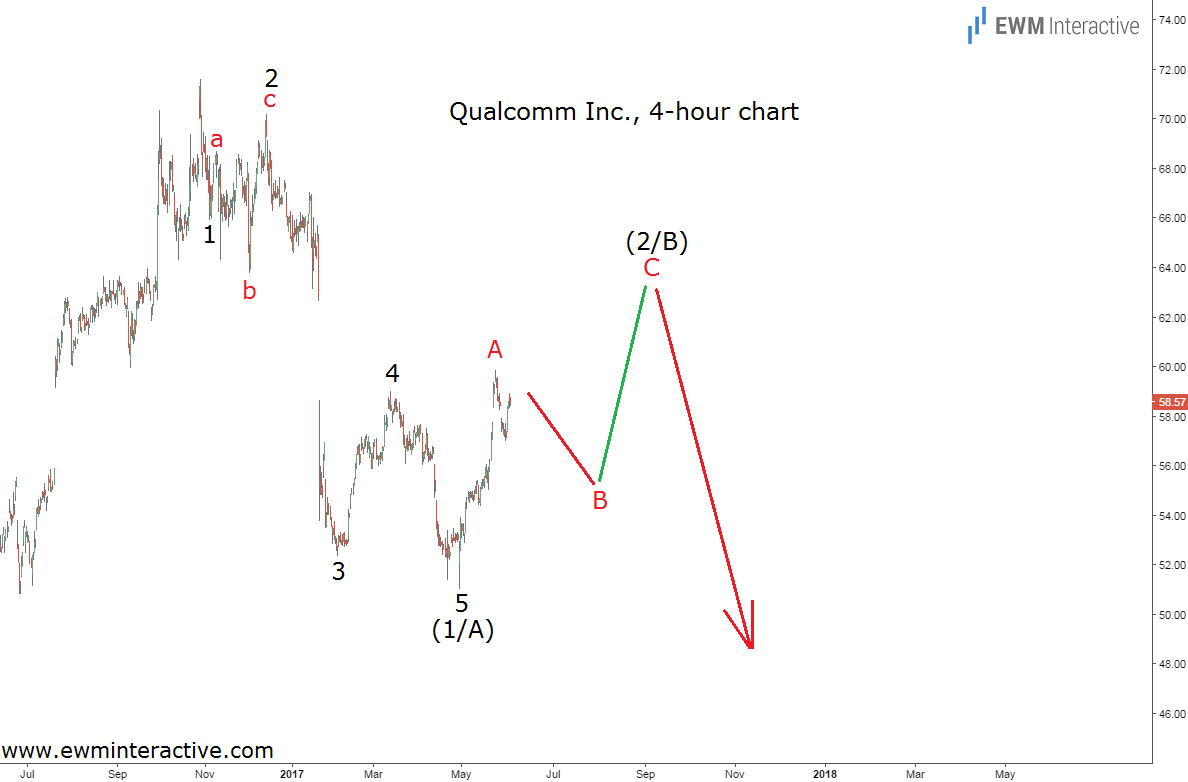
Qualcomm Elliott Wave Chart

The chart visualizes not only the current strength, but also the preceding decline between $71.61 and $51.06. It allows us to take a look at its structure and recognize a clear five-wave impulse. The rule of alternation has been taken into account, since wave 2 is a sideways correction in the form of an expanding flat, while wave 4 is very sharp. Every impulse is followed by a three-wave retracement in the other direction. The current recovery should be part of this retracement. If this is the correct count, we should expect waves B and C of (2/B) to develop.

Once the correction is over, the Elliott Wave Principle suggests the trend should resume in the direction of the impulsive sequence. The market does not like gaps, so I suspect wave (2/B) to exceed the $60 mark, in order to close the gap left by wave 3 of (1/A). Once it is closed, the bears should be expected to drag Qualcomm stock to a new multi-month low beneath $51 a share in wave (3/C) to the south. Even if the bulls breach $60, the negative outlook would remain valid as long as the starting point of wave (1/A) at $71.61 is intact.

3rd party Ad. Not an offer or recommendation by Investing.com. See disclosure here or remove ads .

Original post

Latest comments

Risk Disclosure: Trading in financial instruments and/or cryptocurrencies involves high risks including the risk of losing some, or all, of your investment amount, and may not be suitable for all investors. Prices of cryptocurrencies are extremely volatile and may be affected by external factors such as financial, regulatory or political events. Trading on margin increases the financial risks.
Before deciding to trade in financial instrument or cryptocurrencies you should be fully informed of the risks and costs associated with trading the financial markets, carefully consider your investment objectives, level of experience, and risk appetite, and seek professional advice where needed.
Fusion Media would like to remind you that the data contained in this website is not necessarily real-time nor accurate. The data and prices on the website are not necessarily provided by any market or exchange, but may be provided by market makers, and so prices may not be accurate and may differ from the actual price at any given market, meaning prices are indicative and not appropriate for trading purposes. Fusion Media and any provider of the data contained in this website will not accept liability for any loss or damage as a result of your trading, or your reliance on the information contained within this website.
It is prohibited to use, store, reproduce, display, modify, transmit or distribute the data contained in this website without the explicit prior written permission of Fusion Media and/or the data provider. All intellectual property rights are reserved by the providers and/or the exchange providing the data contained in this website.
Fusion Media may be compensated by the advertisers that appear on the website, based on your interaction with the advertisements or advertisers.
© 2007-2024 - Fusion Media Limited. All Rights Reserved.