
Public Storage’s (NYSE:PSA) fourth-quarter 2017 core funds from operations (FFO) per share of $2.75 marked 3.8% growth from the prior-year quarter figure of $2.65 and also surpassed the Zacks Consensus Estimate of $2.72.
Results mirror an improvement in net operating income (NOI) from both same-store and non-same store facilities. Higher realized annual rent per occupied square foot supported the company’s same-store performance. Also, Public Storage benefited from its expansion efforts.
Quarterly revenues of $672.3 million also climbed 3.2% from the prior-year quarter. However, the figure missed the Zacks Consensus Estimate of $680.5 million.
For full-year 2017, core FFO per share came in at $10.23, well ahead of the prior-year tally of $9.79. This was backed by 4.2% year-over-year growth in total revenues to $2.7 billion.
Behind the Headlines
Same-store revenues advanced 2.1% year over year to $551.7 million during the fourth quarter, while the company’s NOI climbed 2.0% to $434.7 million. The increase in same-store revenues was primarily driven by a 3.0% rise in realized annual rental income per occupied square feet to $17.40. However, the weighted-average square foot occupancy of 93.1% contracted 70 basis points year over year.
In addition, the company’s NOI from non-same store facilities grew on the back of the 345 self-storage facilities acquired, developed or expanded since January 2015.
Portfolio Activity
In the reported quarter, Public Storage bought eight self-storage facilities, comprising 0.5 million net rentable square feet, for $68.1 million. Following the quarter end, the company acquired or was under contract to acquire two self-storage facilities, spanning 0.2 million net rentable square feet of space, for $18 million.
Finally, as of Dec 31, 2017, the company had several facilities in development (2.7 million net rentable square feet), with an estimated cost of $367 million, as well as expansion projects (1.9 million net rentable square feet) worth roughly $247 million. Public Storage estimates to incur the remaining $350 million of development costs related to these projects mainly over the next 18 months.
Liquidity
Public Storage exited 2017 with around $433.4 million of cash and cash equivalents, up from $183.7 million recorded at the end of the prior year.
Dividend
On Feb 20, Public Storage’s board of trustees announced a regular quarterly dividend of $2.00 per share. The amount will be paid on Mar 29 to shareholders of record as of Mar 14, 2018.
In Conclusion
Public Storage is one of the largest owners and operators of storage facilities in the United States. The company’s acquisition and expansion efforts look promising. Further, a solid balance sheet has enabled the company to pay sustainable dividends. However, supply has been rising in a number of its markets. This limits the company’s power to raise rents and turn on more discounting. Furthermore, rate hike remains another concern.
Public Storage currently has a Zacks Rank #3 (Hold). You can see the complete list of today’s Zacks #1 Rank (Strong Buy) stocks here.
The stock has declined 3.9% over the past month but outperformed the 5.8% loss incurred by the industry it belongs to.
Public Storage Price, Consensus and EPS Surprise
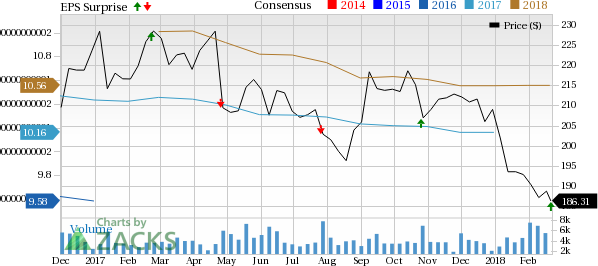
Public Storage Price, Consensus and EPS Surprise | Public Storage Quote
We now look forward to the earnings releases of EPR Properties (NYSE:EPR) , Lamar Advertising Company (NASDAQ:LAMR) and Outfront Media Inc. (NYSE:OUT) , all of which are expected to report their numbers next week.
Note: Anything related to earnings presented in this write-up represent funds from operations (FFO) — a widely used metric to gauge the performance of REITs.
Today's Stocks from Zacks' Hottest Strategies
It's hard to believe, even for us at Zacks. But while the market gained +18.8% from 2016 - Q1 2017, our top stock-picking screens have returned +157.0%, +128.0%, +97.8%, +94.7%, and +90.2% respectively.
And this outperformance has not just been a recent phenomenon. Over the years it has been remarkably consistent. From 2000 - Q1 2017, the composite yearly average gain for these strategies has beaten the market more than 11X over. Maybe even more remarkable is the fact that we're willing to share their latest stocks with you without cost or obligation.
See Them Free>>
Lamar Advertising Company (LAMR): Free Stock Analysis Report
EPR Properties (EPR): Free Stock Analysis Report
Public Storage (PSA): Free Stock Analysis Report
OUTFRONT Media Inc. (OUT): Free Stock Analysis Report
Original post