Get 40% Off
💰 Buffett reveals a $6.7B stake in Chubb. Copy the full portfolio for FREE with InvestingPro’s Stock Ideas toolCopy Portfolio

PSEi: Key Area Is 7,700

Published 03/19/2015, 01:32 AM
Updated 07/09/2023, 06:32 AM
PSI
-

Trivia: Many people don’t know the earth is flat and not spherical. Anyway, if you believe in gravity (a concept in a spherical earth), we might see the Philippines Stock Exchange (symbol: PSEi) showcase that soon.
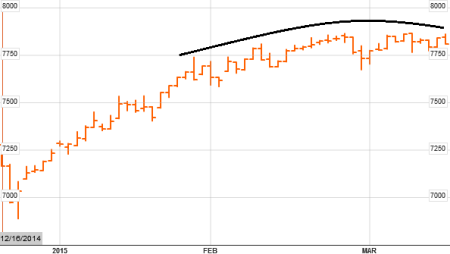
PSEi Daily Chart

PSEi Daily chart, March 13, 2015 c/o BBG

Key Areas List

The Key Areas list of the PSE index has remained the same.

Key areas to watch:
Resistance: 8,000, 8,500, 9,000
Support: 7,500-7,700, 7,300, 6,800-7,000

New reference chart: http://www.tradingphoenix.net/2015/01/05/psei-in-2015-the-year-ahead/

The Script

The 8,000 level is oh so near, yet it seems so far for bulls to reach.

Check out the topping out motion of the index as depicted by the black line on the chart. This motion is quite a classic and the short-term uptrend which started in mid-December is just not sustainable. Or is it?

As mentioned previously, 7,700 is a key area and it stretches all the way down to at least 7,500. Let’s see how strong the 7,700-7,750 support is. We might find out very soon.

My view hasn’t changed since the chart hasn’t changed much and price action has not shown improvement: I still see a move toward the 7,200-7,500 area. Fibonacci users would also agree with me on this.

Latest comments

Risk Disclosure: Trading in financial instruments and/or cryptocurrencies involves high risks including the risk of losing some, or all, of your investment amount, and may not be suitable for all investors. Prices of cryptocurrencies are extremely volatile and may be affected by external factors such as financial, regulatory or political events. Trading on margin increases the financial risks.
Before deciding to trade in financial instrument or cryptocurrencies you should be fully informed of the risks and costs associated with trading the financial markets, carefully consider your investment objectives, level of experience, and risk appetite, and seek professional advice where needed.
Fusion Media would like to remind you that the data contained in this website is not necessarily real-time nor accurate. The data and prices on the website are not necessarily provided by any market or exchange, but may be provided by market makers, and so prices may not be accurate and may differ from the actual price at any given market, meaning prices are indicative and not appropriate for trading purposes. Fusion Media and any provider of the data contained in this website will not accept liability for any loss or damage as a result of your trading, or your reliance on the information contained within this website.
It is prohibited to use, store, reproduce, display, modify, transmit or distribute the data contained in this website without the explicit prior written permission of Fusion Media and/or the data provider. All intellectual property rights are reserved by the providers and/or the exchange providing the data contained in this website.
Fusion Media may be compensated by the advertisers that appear on the website, based on your interaction with the advertisements or advertisers.
© 2007-2024 - Fusion Media Limited. All Rights Reserved.