Two names: one that reports after the close - SanDisk, SNDK, and one that reports before the open Thursday, Verizon, VZ.
SanDisk, SNDK
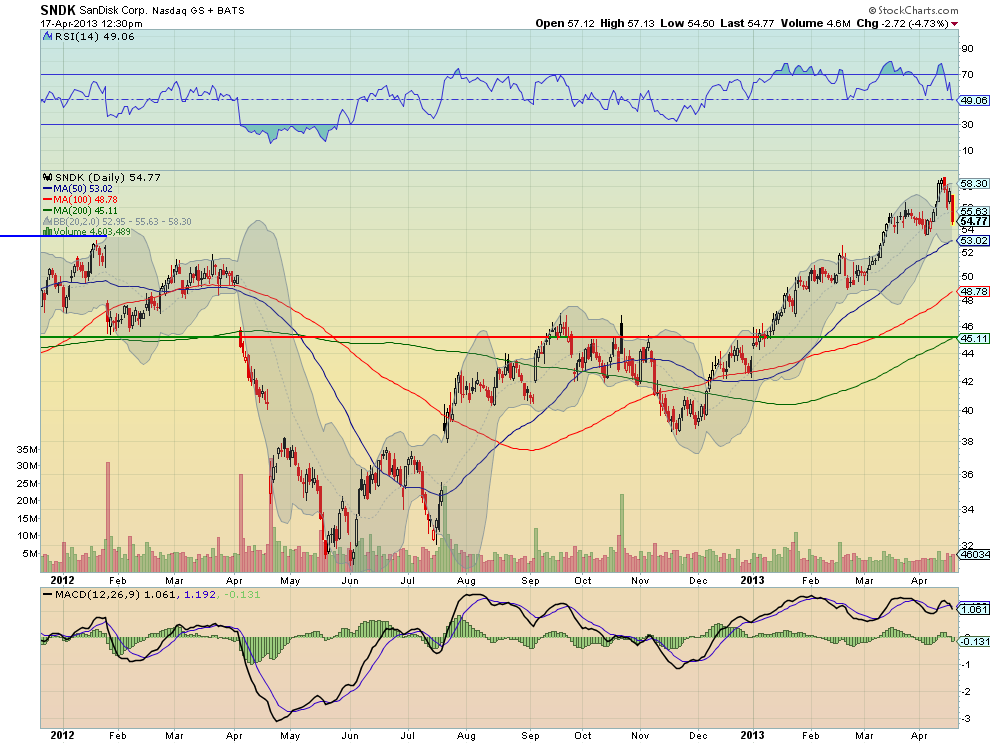
SanDisk, SNDK, has been in an uptrend since making a double bottom at 38.5 late November. The 20 day Simple Moving Average (SMA) has acted as support during this run, and is being broken to the downside today. The Relative Strength Index (RSI) is bullish, holding the mid line but pointing lower with a Moving Average Convergence Divergence (MACD) indicator that is also drifting sideways at highs. A neutral to downside bias in the chart short term in the uptrend. Support lower comes at 53.50 and 51.70, followed by 49.15 and 46.60. Resistance higher is found at 55.90 and 58.92 with free air above that. The reaction to the last 6 earnings reports has been a move of about 5.67% on average, or $3.15 making for an expected range of 51.40 to 58.00. The at-the money April Straddles suggest a larger $3.90 move by Expiry with Implied Volatility at 111% well above the May at 42%. There was a large trade of about 2500 April 57.5/60 Call Spreads on the offer done just before 11 o’clock today, pointing bullish.
- Trade Idea 1: Buy the April 52.5 Put for $1.00.
- Trade Idea 2: Buy the April 52.5 Put and sell May 50 Put for $0.05.
- Trade Idea 3: Buy the May 55/50 Put Spread for $2.00.
- Trade Idea 4: Sell the May/July 50 Put Calendar for a $1.14 Credit.
- Trade Idea 5: Sell the May/July 50 Put Calendar, and buy the May 55/57.5 Call Spread for $0.10 credit.
Verizon, VZ

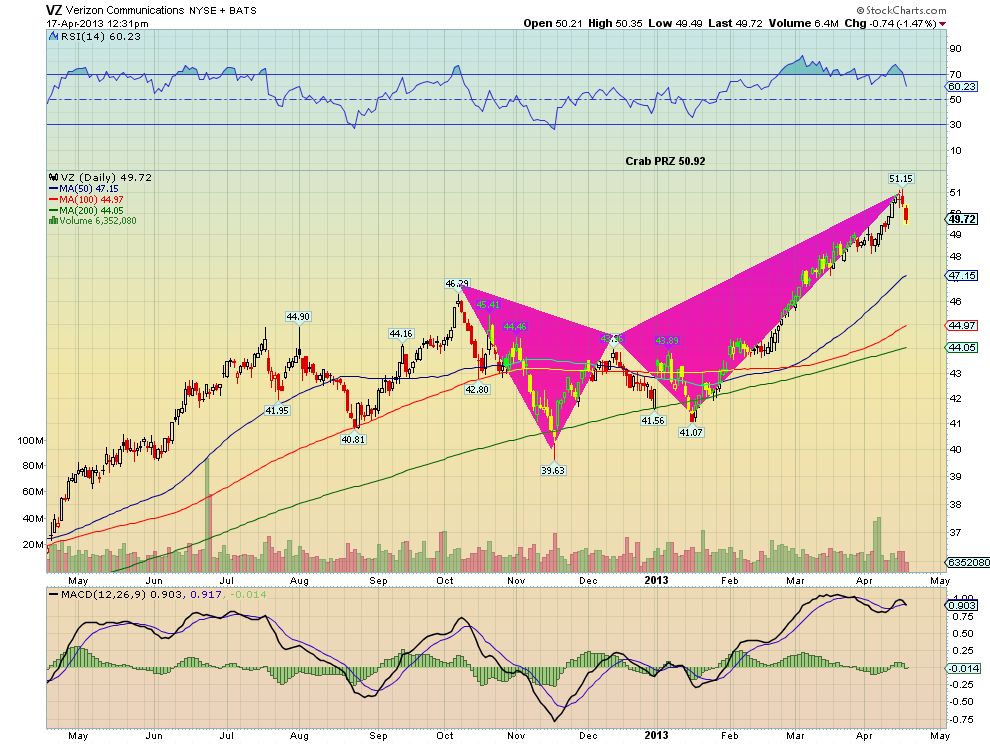
Verizon, VZ, has also moved higher from a January low. It triggered a reversal on the Crab with a move back below 50.92. The Initial Price Objective is to 46.75 followed by 44.03. The RSI is bullish, but moving down after working off a technically overbought condition, with a MACD indicator that is drifting at previous highs. An upside bias longer term, but looks like a pullback for now. Support lower comes at 49 and 48, followed by 47.40 and 46.65. Resistance higher is found at 51.15. The reaction to the last 6 earnings reports has been a move of about 1.68% on average, or $0.85 making for an expected range of 49 to 50.75. The at-the money April Straddles suggest a larger $1.12 move by Expiry with Implied Volatility at 37% above the May at 17%. There has been lots of put buying, not spreads, perhaps indicating protecting stock.
- Trade Idea 1: Buy the April 49/48 1×2 Put Spreads for $0.04. On a flush puts you in the stock Friday at 47.
- Trade Idea 2: Buy the May 49/47 Put Spread for $0.46.
- Trade Idea 3: Buy the May 49/47 1×2 Put Spread for $0.18.
Participate in the downside until 47 and own the stock at 45 if it continues to fall.
The information in this blog post represents my own opinions and does not contain a recommendation for any particular security or investment. I or my affiliates may hold positions or other interests in securities mentioned in the Blog, please see my Disclaimer page for my full disclaimer.
Original post
