Two names today that report Wednesday after the close PVH (PVH), and Red Hat, (RHT)
PVH, (PVH)
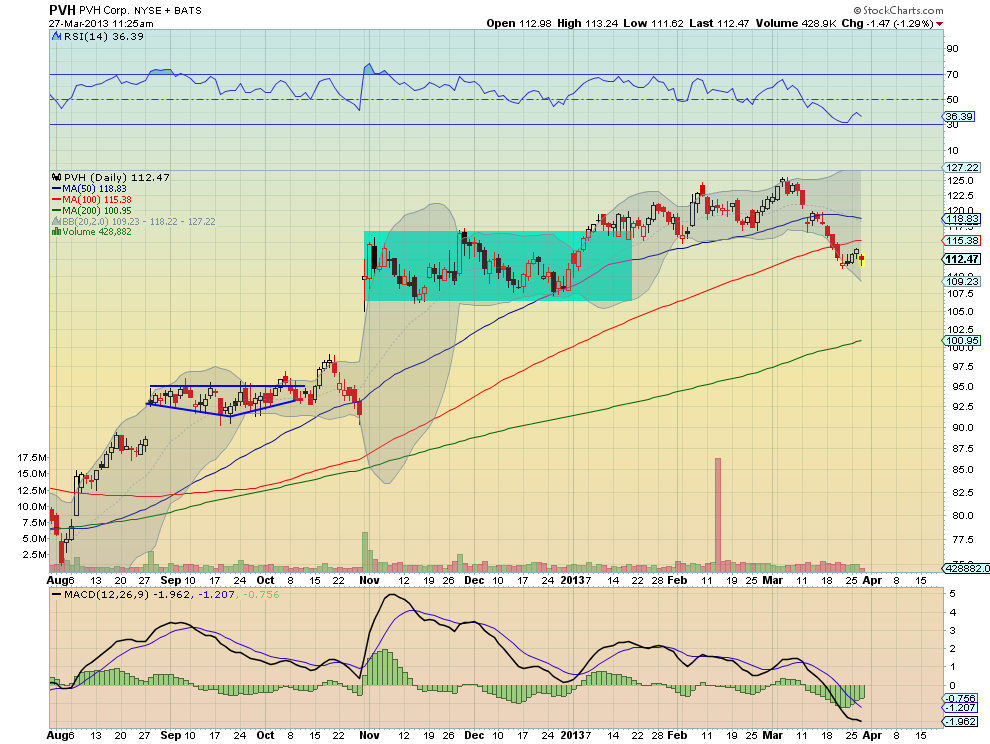
PVH, (PVH), fell back from a break out high at 125, under the 50 day and 100 day Simple Moving Averages (SMA) and is now consolidating in a bear flag in the previous consolidation zone. The Relative Strength Index (RSI) is bearish, and has been drifting lower with a Moving Average Convergence Divergence (MACD) indicator that is also drifting lower, but starting to improve on the histogram. A neutral bias but with a slight downside bent. Support lower comes at 106.85, followed by 98.65 and 91.33. Resistance higher is found at 115.70 and 120, followed by 125.50. The reaction to the last 6 earnings reports has been a move of about 4.87% on average or $5.55, making for an expected range of 51.20 to 56.15. The at-the money April Straddles suggest a larger $8.50 move by Expiry with Implied Volatility at 35%, in line with the May at 30%. This is thinly traded, except for a large amount of April 105 Puts traded on the offer.
Trade Idea 1: Buy the April 105 Puts for $1.55.
Trade Idea 2: Buy the April 110/105 Put Spread for $1.90.
Trade Idea 3: Buy the April 105/100 Put Spread for $1.05.
Trade Idea 4: Buy the April 105/110/115/120 Iron Condor for $3.60.
Buying the 115/120 Call Spread and the 110/105 Put Spread looking for the $8 move to happen.
Trade Idea 5: Buy the May 115/120 Call Spread and sell the April 115 Call for free.
All short ideas are similar. The Iron Condor is just a play on a big move.
Red Hat, (RHT) 
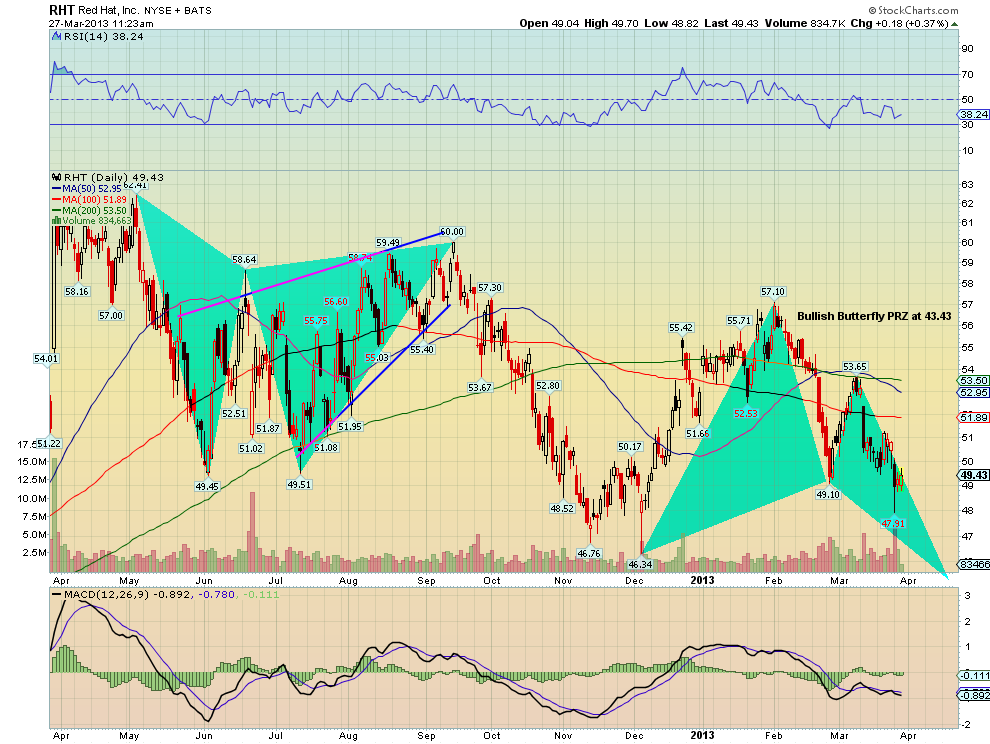
Red Hat, (RHT), has been moving lower, and is now making a lower high and a lower low, pulling back from the top at 57. It is moving in a bullish Butterfly pattern, meaning that it suggests a continued move lower to 43.43 before reversing. The RSI is bearish and moving down with a MACD indicator that is drifting lower. A downside bias. Support lower comes at 49.10 and 46.50ish with a Measured move lower to 45.65. Resistance higher is found at 51.40 and 53.65, followed by 55.50 and 57.10. The reaction to the last 6 earnings reports has been a move of about 7.80% on average or $3.85 making for an expected range of 45.35 to 53.10. The at-the money April Straddles suggest a larger $4.35 move by Expiry, with Implied Volatility at 41% near the May at 37%. April 50/55 Call Spreads are being sold as if they are going out of style, but there was large Open Interest there, so it may be close outs. Either way, sold to open, or sold to close, it is not bullish. Despite this, the 20 biggest trades are all on the call side, a mixed options picture.
Trade Idea 1: Sell the April/May 45 Put Calendar for a $0.40 credit.
Trade Idea 2: Buy the April/May 52.5 Call Calendar for $0.60.
Trade Idea 3: Combine #1 and #2 for a Covered Seagull (I did not make that up) for 20 cents.
The information in this blog post represents my own opinions and does not contain a recommendation for any particular security or investment. I or my affiliates may hold positions or other interests in securities mentioned in the Blog, please see my Disclaimer page for my full disclaimer.
Original post
- English (UK)
- English (India)
- English (Canada)
- English (Australia)
- English (South Africa)
- English (Philippines)
- English (Nigeria)
- Deutsch
- Español (España)
- Español (México)
- Français
- Italiano
- Nederlands
- Português (Portugal)
- Polski
- Português (Brasil)
- Русский
- Türkçe
- العربية
- Ελληνικά
- Svenska
- Suomi
- עברית
- 日本語
- 한국어
- 简体中文
- 繁體中文
- Bahasa Indonesia
- Bahasa Melayu
- ไทย
- Tiếng Việt
- हिंदी
Premium Earnings 3-27-13, PVH And Red Hat
Published 03/28/2013, 01:47 AM
Updated 05/14/2017, 06:45 AM
Premium Earnings 3-27-13, PVH And Red Hat
Latest comments
Loading next article…
Install Our App
Risk Disclosure: Trading in financial instruments and/or cryptocurrencies involves high risks including the risk of losing some, or all, of your investment amount, and may not be suitable for all investors. Prices of cryptocurrencies are extremely volatile and may be affected by external factors such as financial, regulatory or political events. Trading on margin increases the financial risks.
Before deciding to trade in financial instrument or cryptocurrencies you should be fully informed of the risks and costs associated with trading the financial markets, carefully consider your investment objectives, level of experience, and risk appetite, and seek professional advice where needed.
Fusion Media would like to remind you that the data contained in this website is not necessarily real-time nor accurate. The data and prices on the website are not necessarily provided by any market or exchange, but may be provided by market makers, and so prices may not be accurate and may differ from the actual price at any given market, meaning prices are indicative and not appropriate for trading purposes. Fusion Media and any provider of the data contained in this website will not accept liability for any loss or damage as a result of your trading, or your reliance on the information contained within this website.
It is prohibited to use, store, reproduce, display, modify, transmit or distribute the data contained in this website without the explicit prior written permission of Fusion Media and/or the data provider. All intellectual property rights are reserved by the providers and/or the exchange providing the data contained in this website.
Fusion Media may be compensated by the advertisers that appear on the website, based on your interaction with the advertisements or advertisers.
© 2007-2024 - Fusion Media Limited. All Rights Reserved.
