A general review of the current status across different asset markets. This is not comprehensive, forward-looking analysis as per NFTRH, but it is an up to the minute summary (as of Friday afternoon).
Precious Metals
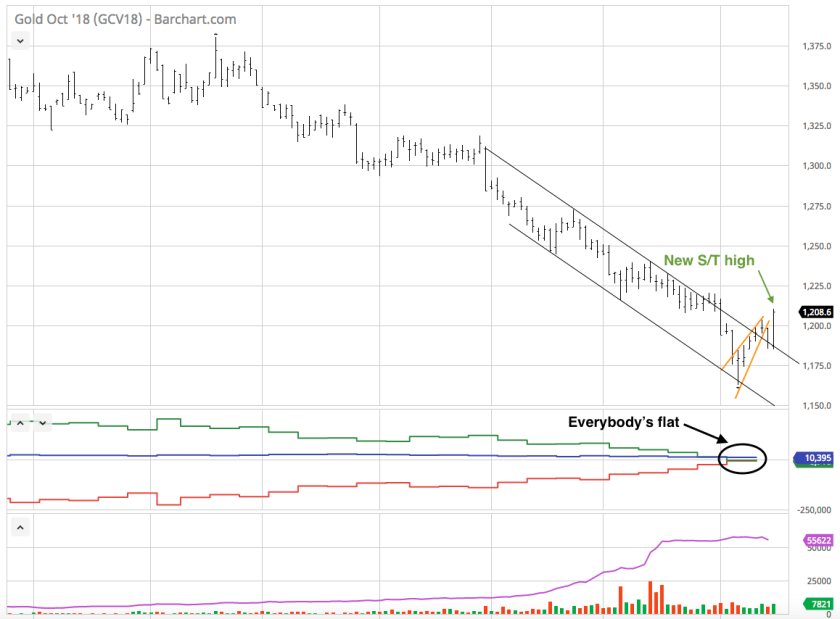
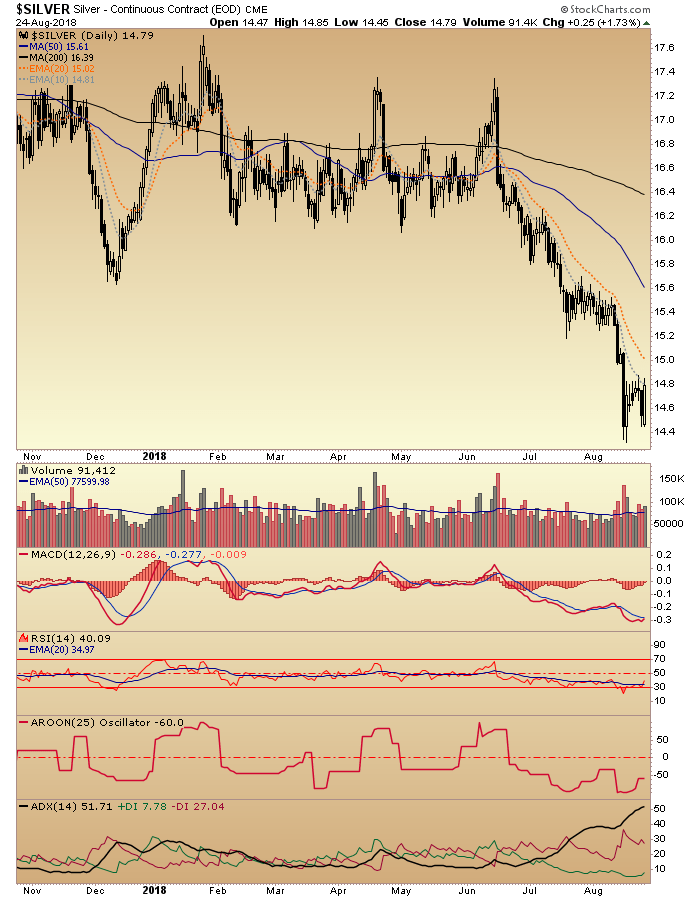
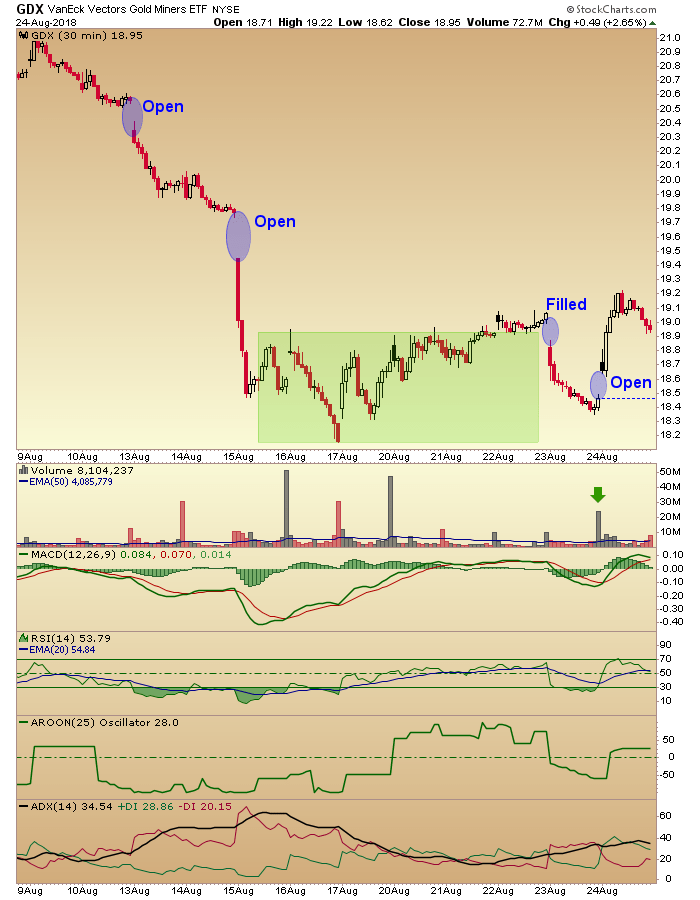
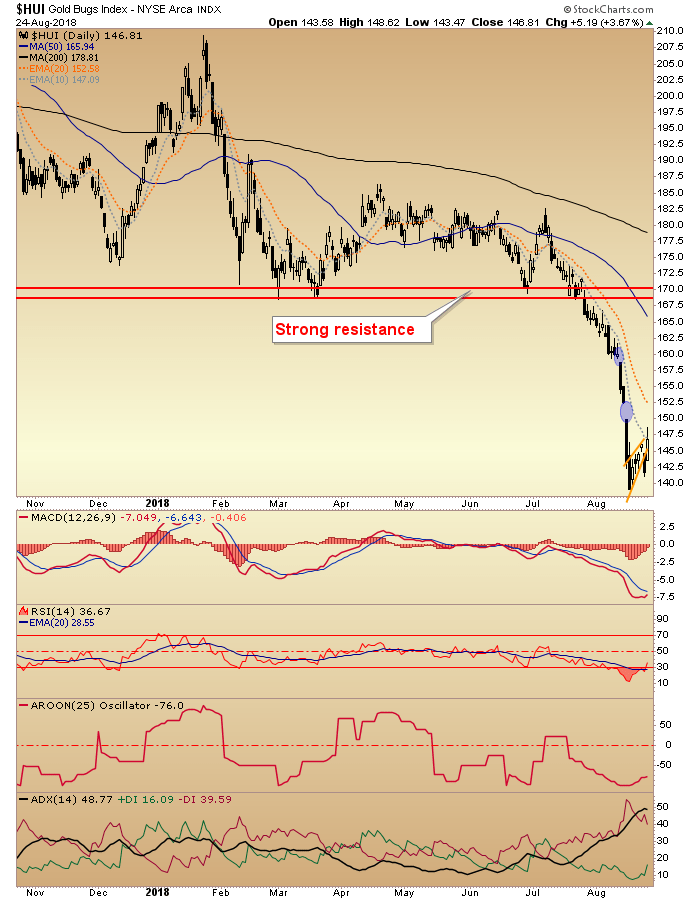
Gold, silver and gold Stock indexes/ETFs made what I had thought were bear flags yesterday, but today painted them as short-term ‘W’ bottom patterns, in silver and the miners anyway.
This chart of gold (courtesy of Barchart.com) shows a flag breakdown, whipsaw and new closing high for the short-term move. As we’ve noted for weeks now, the Commitments of Traders (CoT) is in a contrary bullish alignment with large Specs all but wrung out of the market (they were fleeced again; don’t believe hype about their increased shorting being some sort of conspiracy). All in all, not bad for the relic. The bounce lives on.
Silver (switching back to our regular charting platform, stockcharts.com) is not in quite as good a CoT situation (not shown here) but it’s not bad either. It is constructive for a bounce, at least. A nice whipsaw sees silver close above this week’s previous closing highs. It too repaired any issue from its flag and is constructive for a continued bounce.
The 30 minute GDX (NYSE:GDX) chart used in this morning’s post shows the whipsaw below the upper support of a nice looking bottom pattern (green shaded) and bounce back above. Are we filling this gap and declining again? It’s possible this morning’s gap will fill short-term, but the bounce should continue at some point. There are a couple upper gaps that can fill as well, after all. As will be noted below, the fundamentals are not in order for the sector.
Let’s switch to the HUI index for a daily gold stock view. The close above all of the week’s previous highs after the flag reversal is positive and implies coming near-term upside. No brainer resistance is noted and should be well respected if the fundamentals do not come in line. There are however, lower data points that could limit the move as well. For those NFTRH uses long-term charts.
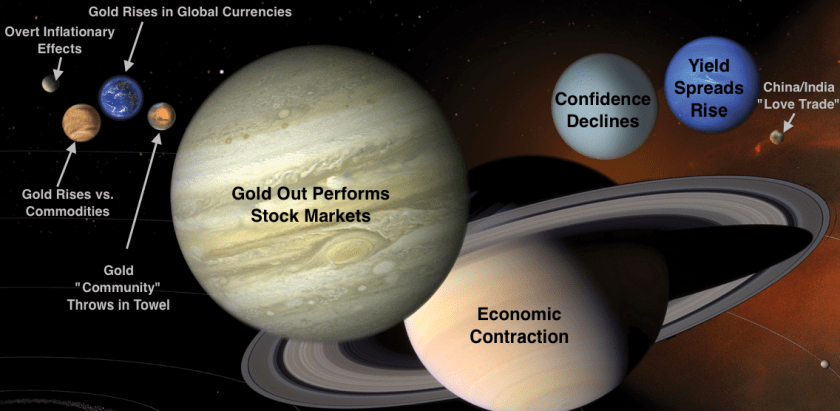
The fundamentals have been mentioned a few times above and what are they? We again review the Macrocosm.
- Gold must begin to outperform vs. stock markets. While the ratio is stretched to the downside, there is no sign yet of a turn in this indicator.
- Signs of economic contraction should come into play. NFTRH is following an interesting early cyclical indicator in particular that has gone negative. That is the Semi Equipment sector’s downside leadership to the broad Semi sector. But that alone is not enough to turn the macro. I wrote the word “early” for a reason.
- The Yield Curve needs to stop flattening and/or start to steepen, which would go hand in hand with economic stress and lead to…
- A decline in confidence by the average market participant.
These would-be factors drive gold vs. cyclical assets and hence, would improve the gold miners’ leverage to the price of gold as their cost inputs decline relative to their product. Speaking of confidence, avoid all talk of “love trade”, “fear trade” and global inflationary economic growth when trying to sort out the gold sector’s fundamentals with respect to buying. That is a confidence play. Gold would under perform in that environment. You buy the gold sector hard when it is getting whacked under pains of deflationary signaling.
Commodities
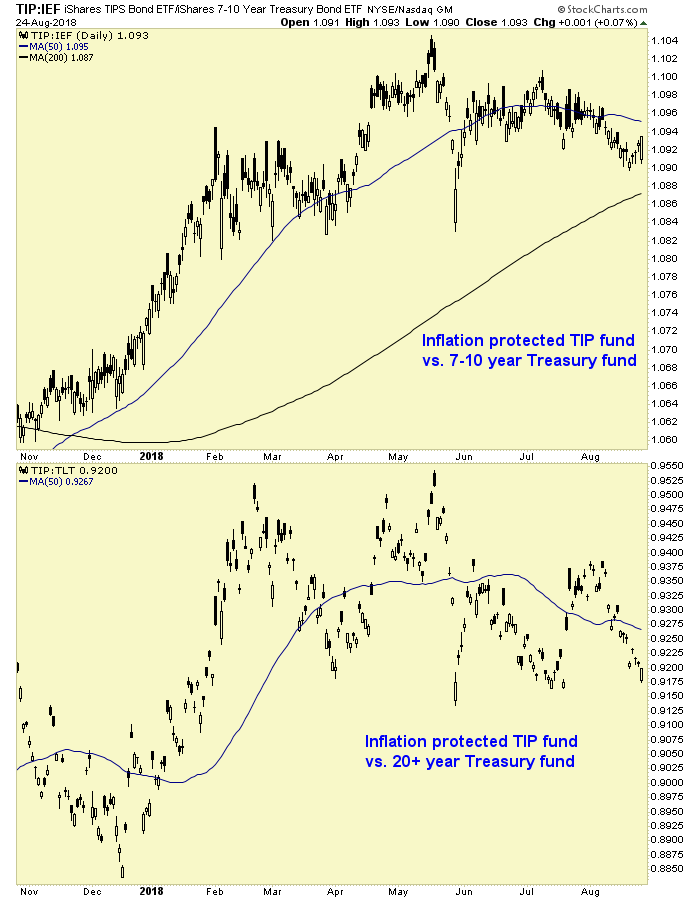
So if we are going to tune out cyclical inflation as a prime driver of gold, we are going to tune it in as a prime driver of cyclical commodities. These inflation expectations gauges state that it’s simply not in play. I believe the dramatic drop in the precious metals – which led the anti-USD inflation trade (Q1 2016) that recently expired (with commodities and global stocks topping out) is a leading indicator for resumed bearishness out ahead for commodities.
To paraphrase Babu berating Jerry Seinfeld, where are inflation expectations… show me inflation expectations!
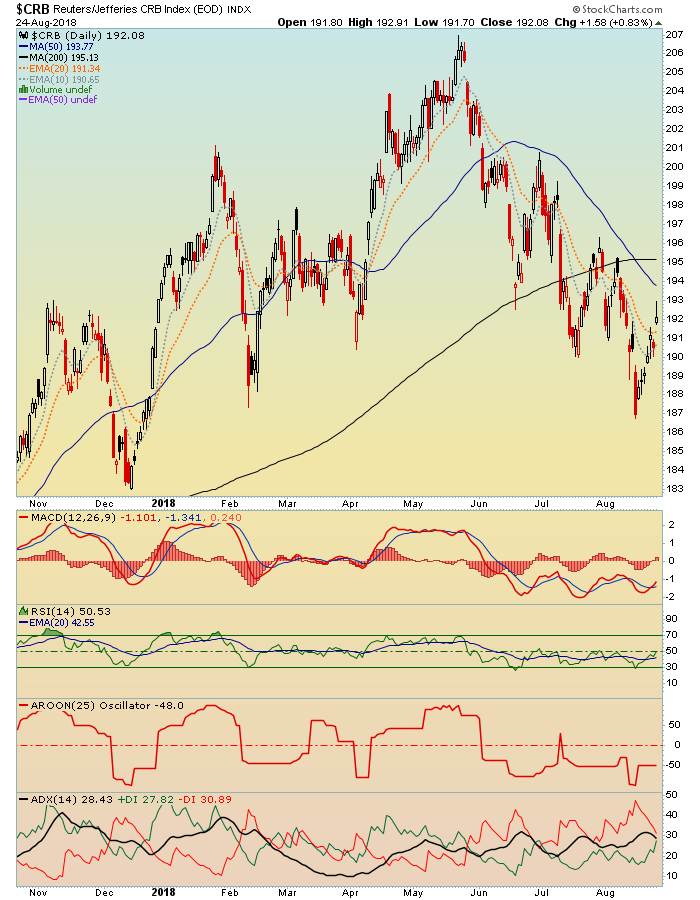
CRB has bounced, but remains in an orderly downtrend since just after the charts above topped out in May. Not a coincidence. If inflation fears make a comeback we’ll change our stance. But not until.
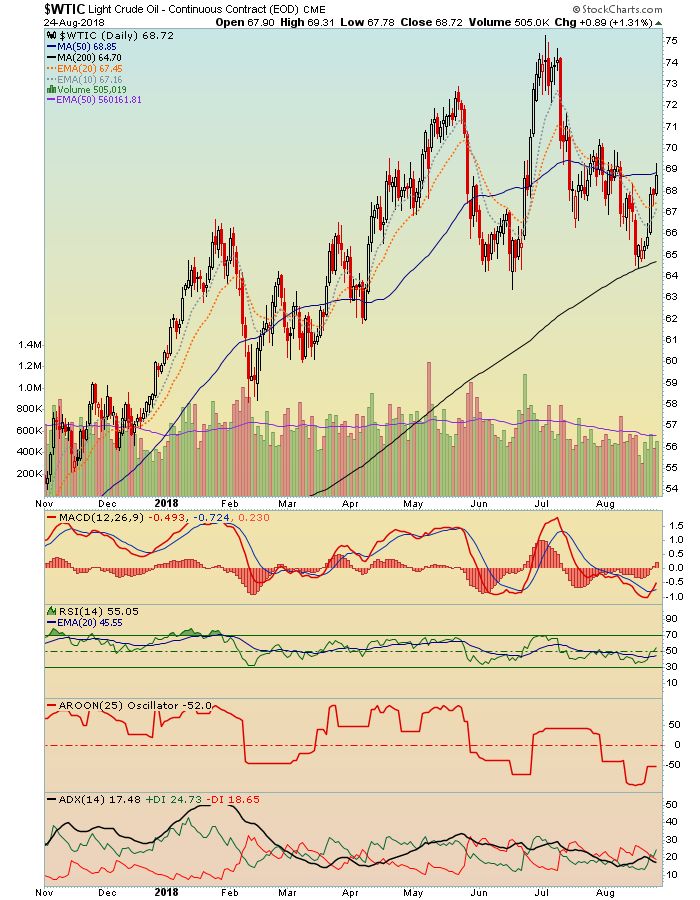
The index has been held up by the relatively strong Crude Oil, but this item too is vulnerable. Indeed, below the SMA 50 it looks more like a short than a long.
US & Global Stock Markets
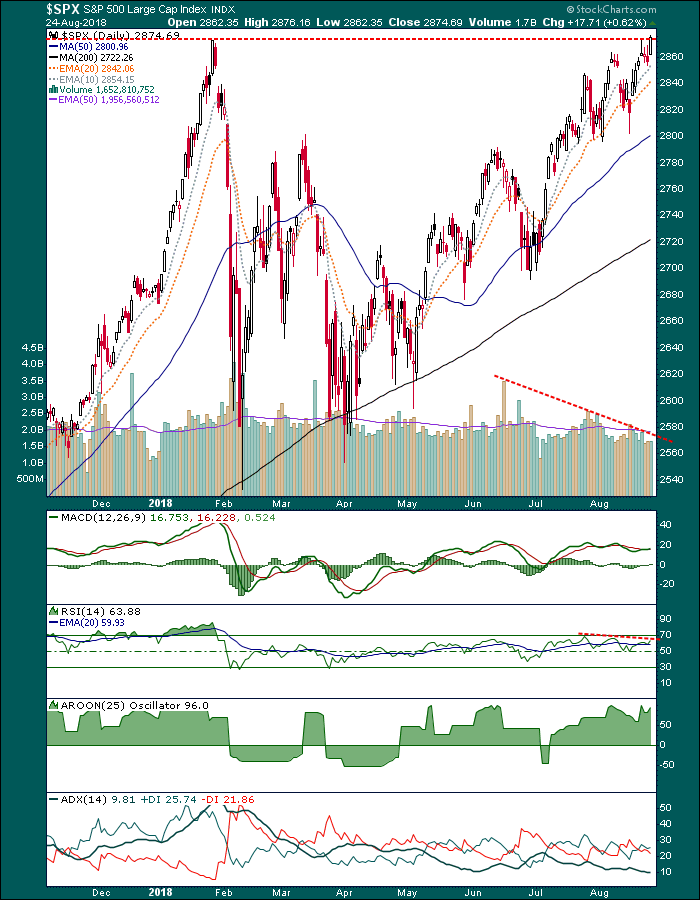
And here we have what is perhaps the most interesting market of all right now. Ladies and Gentlemen, our beloved bloated pig of a US stock market in the form of the S&P 500. Since the lows last spring NFTRH has been working on a short-term bullish “top-test” theme. My preference has been for the test to fail but there is also an alternate view we carry forward; and that view would prove utterly disgusting to bears. The pattern’s measurement is up around 3000.
Now, SPX has been rising on waning summer volume and today it made the big ‘New All-Time Closing High’ headline. I did not look at the media because I have better things to do with my time, but I assume they are or will be trumpeting this.
Aside from waning volume SPX has a bit of RSI divergence. Yet the market will be right if SPX breaks out and holds the breakout, as it would then target 3000. But the ‘top-test’ is still in progress. This is not nearly conclusive and could well be a suck-in before da boyz comes back from da Hamptins to take over.
A fine line between pleasure and pain. Gold bugs by the way, want to see this pig on a spit.
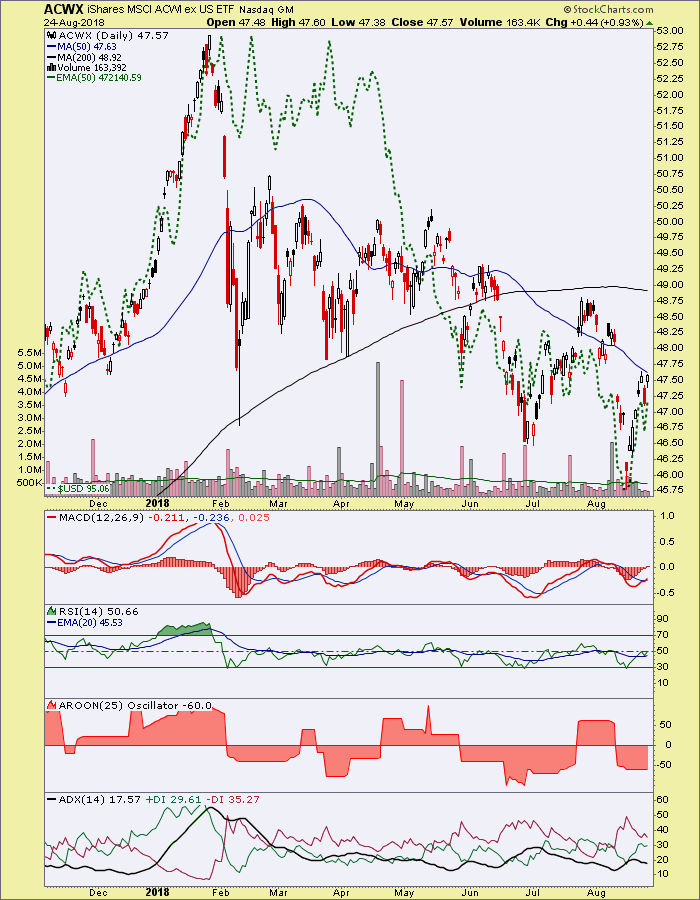
Finally, a look at the World ETF (ex-US) shown with its post-April running mate, the inverse US dollar (green dashed line). If recent trends are to hold, if you are a USD bull you are a World bear. Conversely, a USD bear sees global stocks as a buying opportunity. This is a view of the anti-USD inflation trade. It’s been in the dumps for most of 2018. A stand-alone technical view of iShares MSCI ACWI ex US (NASDAQ:ACWX) shows a downtrend still in force for all of 2018.
As noted, the above is not comprehensive analysis. That is what we do each and every weekend in Notes From the Rabbit Hole. Markets move quickly and we need to stay on top of the key issues each week. But the snapshot above should provide some context for these particular markets at what is likely a key moment in time, with the summer slack season about to end and real business soon to be attended to.

