
As we've been watching the markets recoil away from risks related to the new Omicron COVID variant and other factors, one simple thought keeps running through my head. What if the markets suddenly shift away from this panic selling and resume a rally/recovery trend – possibly pushing to new all-time highs before the end of the year?
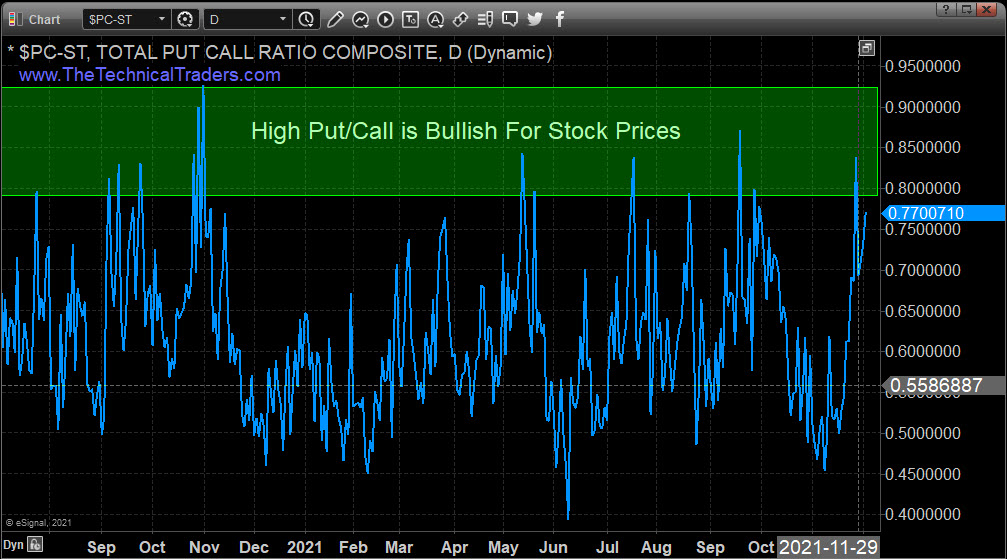
Recently, the put/call ratio reached a moderate-high near 0.84. I interpret this as long traders buying protection in the event of an extended breakdown in the U.S. and global markets. In the past, typically, when the put/call ratio reaches levels above 0.80 – the markets are very close to a bottom.
Prior Downside GAPS Setup A Potential Rip-Your-Face-Off Rally
Next, I noticed the GAP in price on the Dow Jones Industrial Average and the Transportation Index. That got me thinking: “A sudden reversal in price, possibly resulting in a series of price squeeze events, may prompt a strong rally phase back above the GAP levels.” If this happens, we may see a 5% to 7% rally in the U.S. markets take place to restart the Santa rally phase.
INDU Gap Near $35,600 May Become A Clear Upside Target
This daily INDU chart shows the GAP I'm talking about. It also shows what I expect may happen if the markets shake off the Omicron fears and get back into bullish trending mode. It won't take much to drive the INDU 7% higher from recent lows if fear subsides and traders pile into long positions expecting Q4:2021 to be strong and the Santa rally to kick in.

TRAN Gap Near $16,800 May Provide Additional Confirmation Of A Bullish Rally Phase
This daily TRAN chart shows a similar GAP in price that could also trigger a big rally towards new all-time highs if the markets suddenly shift gears. The fear that settled over the global markets because of the Omicron virus strain may have pushed the markets into a fairly deep pullback. As we've seen repeatedly, when these pullbacks end, the U.S. markets shift back into strong bullish price trending and often rally to new all-time highs.
This gap on the TRAN chart may further confirm that the downside price pressure has ended and a new rally phase is setting up for the U.S. markets.

I believe the global markets will attempt to move past the fear we've seen related to the Omicron virus strain. It is becoming more evident that many nations are already somewhat prepared to deal with it throughout December/January. If there is sudden news that it, or any new virus strain, is far more dangerous, things could change very quickly. But I believe the U.S. markets are searching for support and are very likely to end 2021 at or near new all-time highs – supporting a very strong Santa rally.