Since both have seen bullish action lately, I thought I'd compare Platinum and Gold.
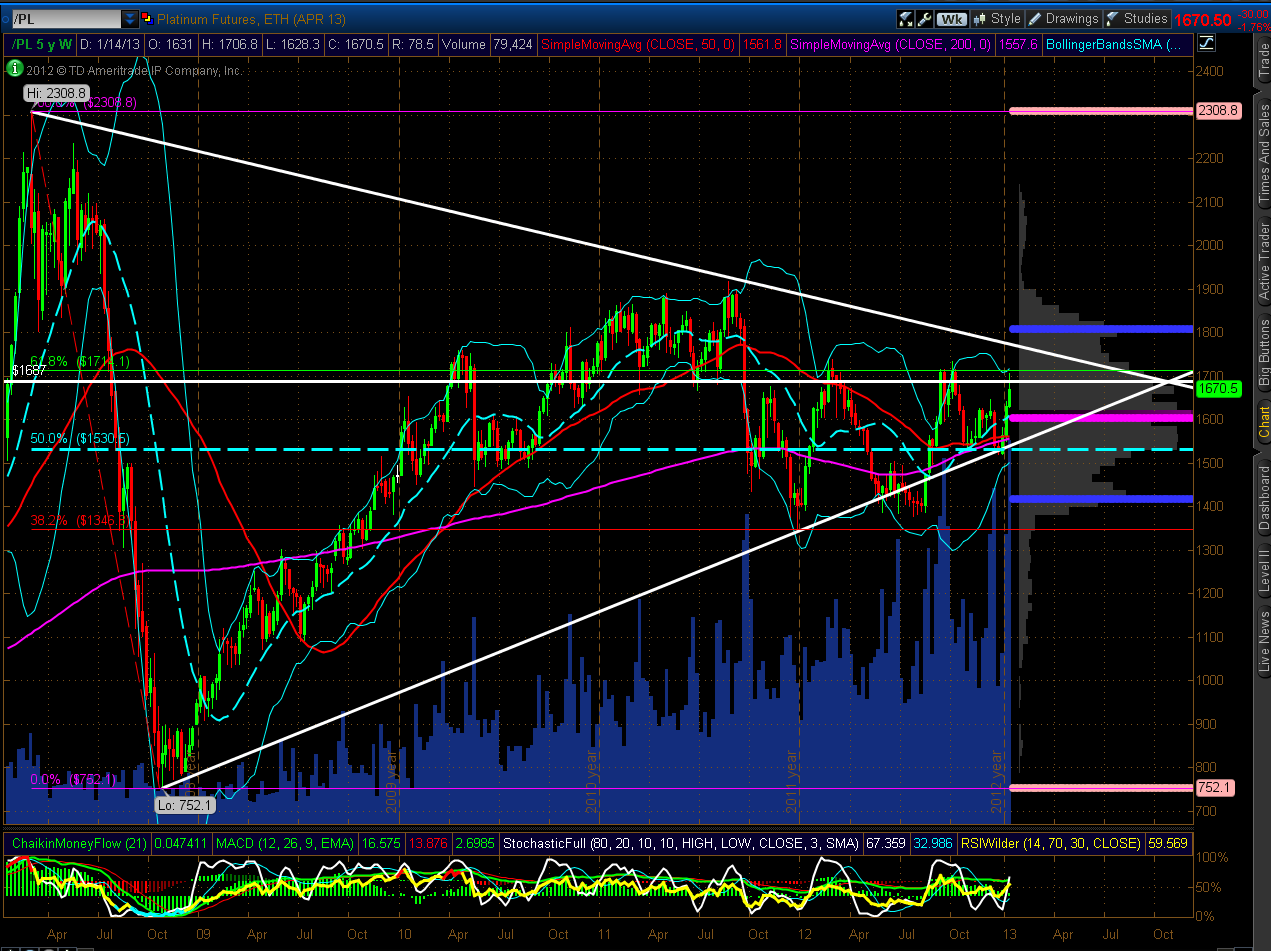
The 5-Year Weekly chart below of Platinum shows that price has stalled at a confluence of an apex of a large triangle, a 60% Fibonacci retracement level, and the upper Bollinger Band. Note the recent volume spikes. If price can break and hold above 1714, it has a chance of reaching the top of the triangle at 1760ish, or 1800 (which is the upper Value Level of the Volume Profile shown along the right edge of the chart).
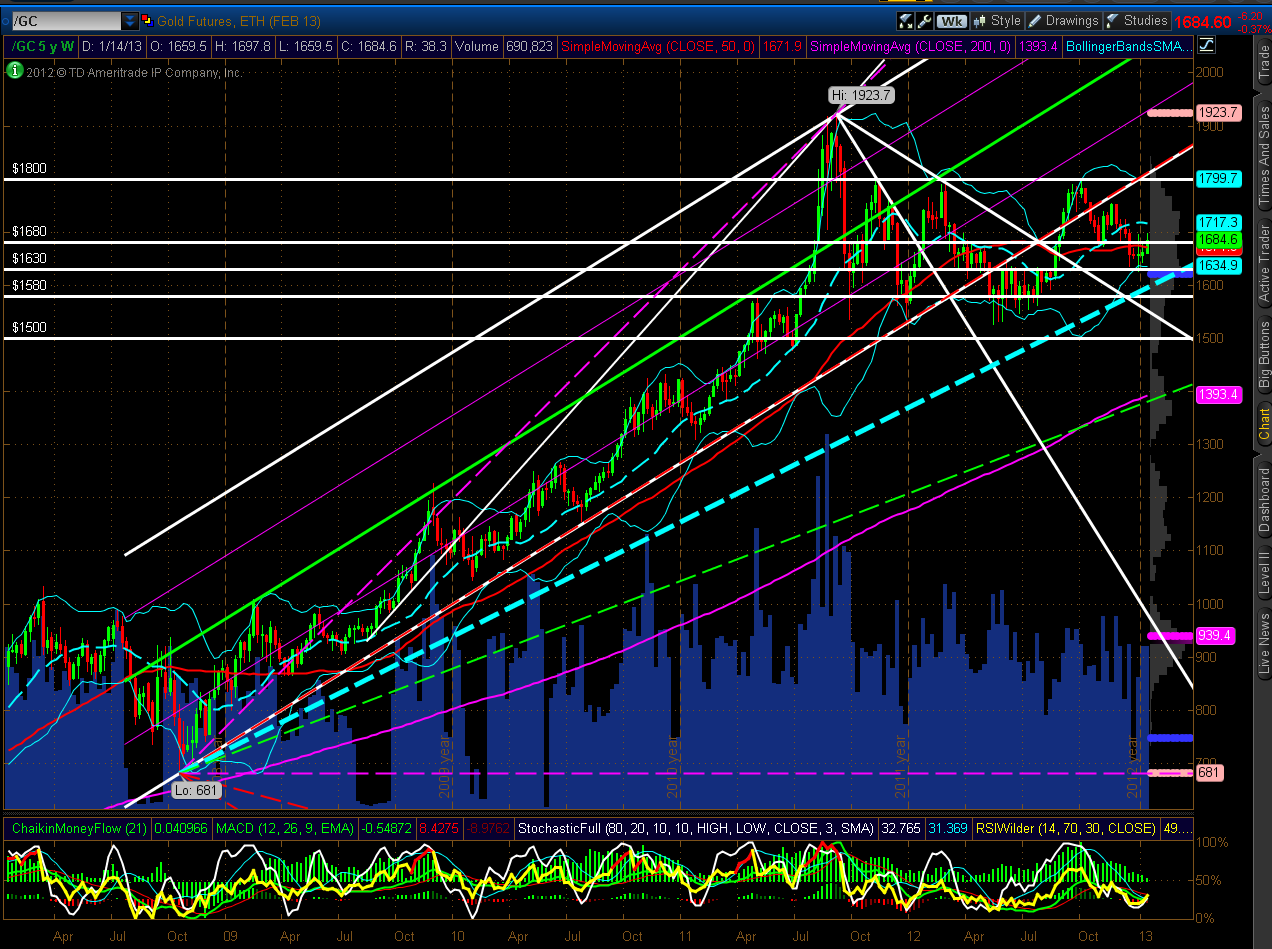
The 5-Year Weekly chart below of Gold shows that price has stalled around the 50 SMA (red) at the 1660 level. The next major resistance level is at 1800, provided it can break and hold above the mid-Bollinger Band at 1717.30.
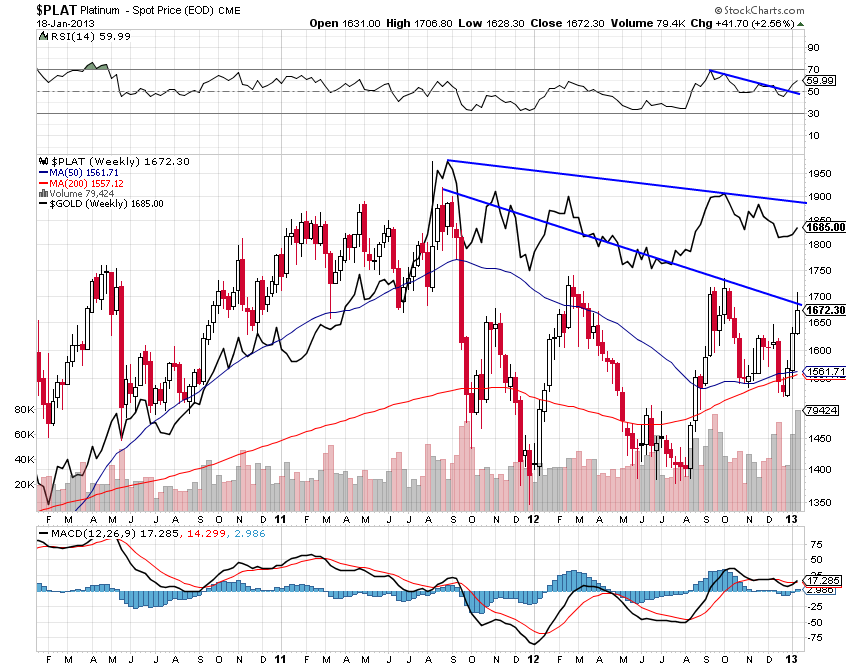
The 3-Year Weekly chart below shows Platinum, depicted in candles as the primary instrument, with Gold as secondary and shown as a line. Both Platinum and Gold have generally tended to move in tandem during this time period. Platinum has stalled at a downtrend line, but the RSI is now rising and above 50.00 and the MACD has crossed up. At the moment, it is outperforming Gold. A break and hold above the downtrend line should favour continued buying in Platinum.
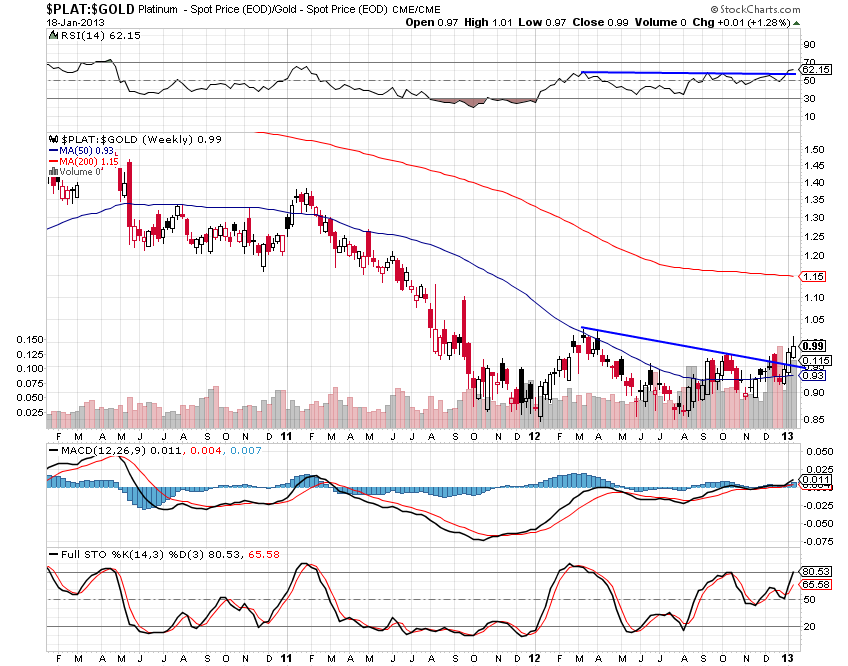
The 3-Year Weekly chart below is a ratio which depicts Platinum's relative strength as compared to Gold. It shows, more clearly, its recent strength on rising RSI, MACD, and Stochastics confirmation.
In conclusion, both Platinum and Gold have similar resistance/target price levels, although Platinum has been a bit stronger recently. It may be worthwhile watching both of them, in order to see which one may produce the first clue as to either continued strength (in both), or developing weakness (in both) during the next week(s) ahead.
- English (UK)
- English (India)
- English (Canada)
- English (Australia)
- English (South Africa)
- English (Philippines)
- English (Nigeria)
- Deutsch
- Español (España)
- Español (México)
- Français
- Italiano
- Nederlands
- Português (Portugal)
- Polski
- Português (Brasil)
- Русский
- Türkçe
- العربية
- Ελληνικά
- Svenska
- Suomi
- עברית
- 日本語
- 한국어
- 简体中文
- 繁體中文
- Bahasa Indonesia
- Bahasa Melayu
- ไทย
- Tiếng Việt
- हिंदी
Platinum: Currently Outperforming Gold
Published 01/21/2013, 12:43 AM
Updated 07/09/2023, 06:31 AM
Platinum: Currently Outperforming Gold
3rd party Ad. Not an offer or recommendation by Investing.com. See disclosure here or
remove ads
.
Latest comments
Install Our App
Risk Disclosure: Trading in financial instruments and/or cryptocurrencies involves high risks including the risk of losing some, or all, of your investment amount, and may not be suitable for all investors. Prices of cryptocurrencies are extremely volatile and may be affected by external factors such as financial, regulatory or political events. Trading on margin increases the financial risks.
Before deciding to trade in financial instrument or cryptocurrencies you should be fully informed of the risks and costs associated with trading the financial markets, carefully consider your investment objectives, level of experience, and risk appetite, and seek professional advice where needed.
Fusion Media would like to remind you that the data contained in this website is not necessarily real-time nor accurate. The data and prices on the website are not necessarily provided by any market or exchange, but may be provided by market makers, and so prices may not be accurate and may differ from the actual price at any given market, meaning prices are indicative and not appropriate for trading purposes. Fusion Media and any provider of the data contained in this website will not accept liability for any loss or damage as a result of your trading, or your reliance on the information contained within this website.
It is prohibited to use, store, reproduce, display, modify, transmit or distribute the data contained in this website without the explicit prior written permission of Fusion Media and/or the data provider. All intellectual property rights are reserved by the providers and/or the exchange providing the data contained in this website.
Fusion Media may be compensated by the advertisers that appear on the website, based on your interaction with the advertisements or advertisers.
© 2007-2024 - Fusion Media Limited. All Rights Reserved.
