
It has been a relentlessly bullish decade (plus) for gold vs. the broad U.S. stock market as the previous stock bull market flamed out and the former Fed chief chose inflation as the preferred means of managing the U.S. economy. We are in the age of Inflation onDemand ™, with stock market performance the result of manipulation of interest rates and currency.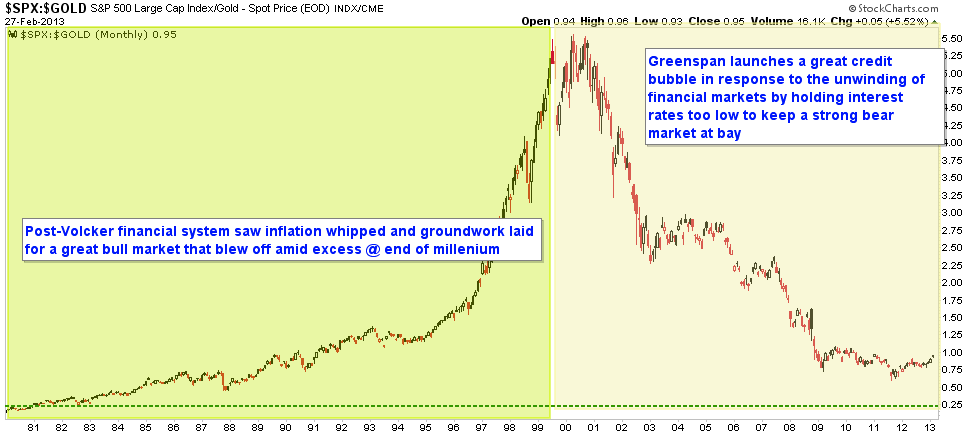
What on earth do gold bugs have to complain about? The monetary barometer is working just fine in its role of indicating that the idea that interest rates can be manipulated to real or productive ends is a bunch of b/s. The stock market as measured in gold is in a technical respite from its decline. That is what is happening and railing at powers that be seeking to keep the poor gold bug from his destiny is wasted energy.
Has the gold sector completed its run? I doubt it because as our Dear ‘Monetary’ Leader just told congress -- and the world -- policy makers have not learned from their inflationary mistakes. Dialing out to a big picture smooths out the emotions of the here and now battle gold bugs find themselves fighting today.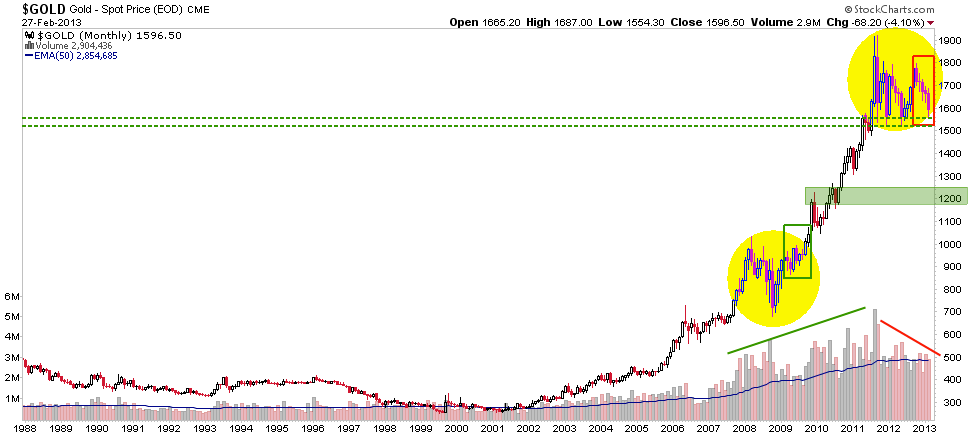
Can nominal gold go lower? I think that any rational reader of that question already knows the answer. These are the financial markets, gold is a unique and strategic financial instrument (and that is all it is, do NOT worship a hunk of metal or even the righteous monetary theories it is emblematic of) and putting your full heart and soul into the equation sets you up for a lot of pain during the interim grind of a financial market big picture.
The chart above shows a support zone in the 1200′s. This is a rough measurement of the pattern in the event that support in the low 1500′s is lost. The yellow shaded areas represent gold’s two major corrections during the secular bull market. Note the green box on the 2009 recovery and the red box on the 2012/13 failure. The two corrections looked very similar until things went the ‘wrong’ way (red box) recently. Gold will either hold support or break down, but ‘they’ are winning right now (duh). Get over it. Furthermore, they are winning while brazenly inflating right in the light of day.
As the stock market rises to a potential limiting big picture parameter, the story being spun is that Goldilocks is here as the DML is in full control and this must be the ‘good’ kind of inflation as the policy is reaching the economy with few signs of inflation’s undesirable side effects.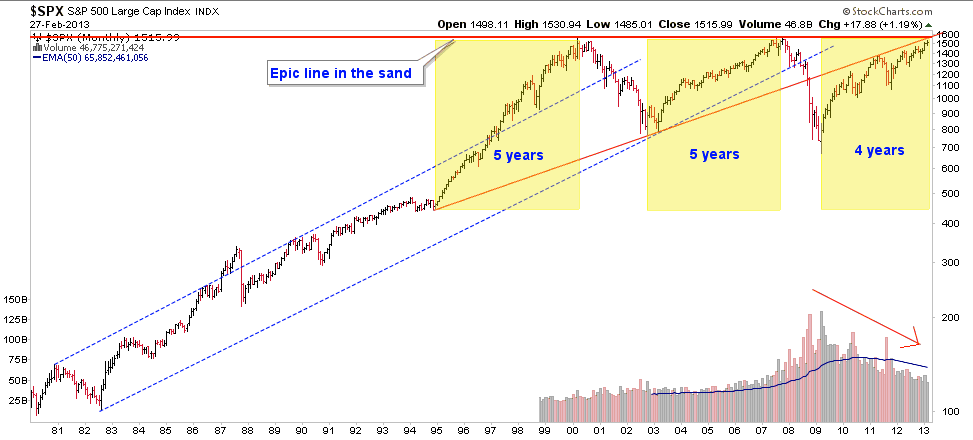
There is no ‘good’ inflation and the stock market is at high risk due to technical factors alone. Our target is higher in the mid to high 1500′s, but risk vs. reward analysis takes into account the entirety of a move and this cycle is at least 80% complete time-wise and 95% complete price-wise from the 2008 low of a Satanic 666. The cyclical bull can drag on for several months yet, but the risk vs. reward will not change from a technical standpoint.
Many gold boosters seem to be seeing the mark of the Devil behind every move and if you have watched this site, you have seen the devil in the details of the Commitments of Traders (CoT) ever since the most recent correction began. Reference a post from September 28.
The point is that if you are going to stand defiant in the face of bearish data points along the way in a war you ultimately expect to win, then do so without the complaining and excuse making. I have personally found myself on the wrong course several times over the last decade. Guess what folks? It is possible to make adjustments -- that sometimes go against core principles or beliefs -- along the way while still holding to those principles and beliefs. It is called market management.
Right now the gold sector seems to show a strange combination of contrarian bullish (players feeling very bearish) sentiment and ongoing bottom-calling bravado. I for one am not sure how this will play out.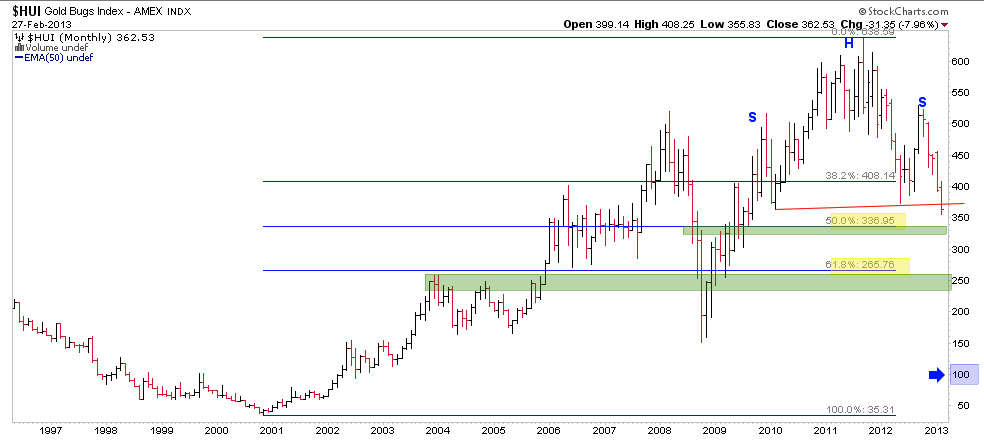
In contrast to the SPX chart above, the monthly HUI looks like an utter mess. Pick a support level… red neckline to the massive H&S? It’s measured target of 100? How about the 50% Fib in the low 300′s or the 62% Fib around 250? This chart demands risk management and has demanded it since short-term charts indicated that the post-QE3 rally was going wrong. That was back in November when 460 was breached.
We are now over three months beyond that warning and the situation is unresolved. I believe gold and even the lowly gold stock sector have more upside in the bull market, but it has been a long while since I have been willing to put unhedged money behind that view. It has been a long while since NFTRH has been able to be anything but cautious to bearish on the gold stocks.
Egos must be controlled and I think that the duration and intense success of the gold bull out of 2001 has distorted many people’s egos. It is as if they have a preordained right to be well… right. They do not. These are the markets and they are bigger than you and you and you… and me. How fitting that a bull market has chosen to grind up and in some cases discredit some of its biggest proponents. Maybe when that process is done, the bull can get back on track.
- English (UK)
- English (India)
- English (Canada)
- English (Australia)
- English (South Africa)
- English (Philippines)
- English (Nigeria)
- Deutsch
- Español (España)
- Español (México)
- Français
- Italiano
- Nederlands
- Português (Portugal)
- Polski
- Português (Brasil)
- Русский
- Türkçe
- العربية
- Ελληνικά
- Svenska
- Suomi
- עברית
- 日本語
- 한국어
- 简体中文
- 繁體中文
- Bahasa Indonesia
- Bahasa Melayu
- ไทย
- Tiếng Việt
- हिंदी
Perspective On Gold And The Stock Market
3rd party Ad. Not an offer or recommendation by Investing.com. See disclosure here or
remove ads
.
Latest comments
Install Our App
Risk Disclosure: Trading in financial instruments and/or cryptocurrencies involves high risks including the risk of losing some, or all, of your investment amount, and may not be suitable for all investors. Prices of cryptocurrencies are extremely volatile and may be affected by external factors such as financial, regulatory or political events. Trading on margin increases the financial risks.
Before deciding to trade in financial instrument or cryptocurrencies you should be fully informed of the risks and costs associated with trading the financial markets, carefully consider your investment objectives, level of experience, and risk appetite, and seek professional advice where needed.
Fusion Media would like to remind you that the data contained in this website is not necessarily real-time nor accurate. The data and prices on the website are not necessarily provided by any market or exchange, but may be provided by market makers, and so prices may not be accurate and may differ from the actual price at any given market, meaning prices are indicative and not appropriate for trading purposes. Fusion Media and any provider of the data contained in this website will not accept liability for any loss or damage as a result of your trading, or your reliance on the information contained within this website.
It is prohibited to use, store, reproduce, display, modify, transmit or distribute the data contained in this website without the explicit prior written permission of Fusion Media and/or the data provider. All intellectual property rights are reserved by the providers and/or the exchange providing the data contained in this website.
Fusion Media may be compensated by the advertisers that appear on the website, based on your interaction with the advertisements or advertisers.
© 2007-2024 - Fusion Media Limited. All Rights Reserved.