
PerkinElmer, Inc. (NYSE:PKI) reported second-quarter 2019 adjusted earnings per share (EPS) of $1, which missed the Zacks Consensus Estimate of $1.01 per share by 0.9%. However, the bottom line improved 9.9% from the year-ago quarter.
Based in Waltham, MA, this leading MedTech company reported revenues of $722.5 million, up 2.7% from the year-ago quarter and improved 5% organically. Adjusted revenues in the quarter came in at $722.7 million, up 2.7% year over year. However, the top line lagged the Zacks Consensus Estimate of $$730.3 million by 1.1%.
Segment Details
DAS
At this segment, revenues totaled $434 million, reflecting an improvement of 0.8% from the year-ago quarter. Organically, the segment grew 2% in the quarter under review. Per management, the second-quarter performance was affected by soft performance in applied markets. However, solid show by life sciences contributed to organic revenue growth.
Coming to profits at the DAS segment, the company reported second-quarter 2019 adjusted operating income of $81.5 million, up 6.7% from the year-ago quarter.
Diagnostics segment
Revenues at this segment amounted to $288.6 million, up 5.8% on a year-over-year basis. Adjusted revenues in the segment totaled $288.7 million, up 5.8% from the prior-year quarter. Organically, the segment grew 9% in the second quarter. Per management, the upside can be attributed to strength across reproductive health, and immunodiagnostics business lines.
Adjusted operating income in the segment totaled $79.7 million, up 3.2% from the year-ago quarter.
PerkinElmer, Inc. Price, Consensus and EPS Surprise
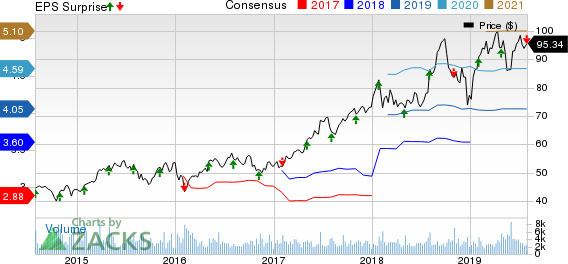
PerkinElmer, Inc. price-consensus-eps-surprise-chart | PerkinElmer, Inc. Quote
Geographical Details
Per management, the major geographies witnessed a mixed second quarter, with high-single digit organic revenue growth in the United States, mid-single digit organic revenue growth in Asia Pacific (APAC) and low-single digit organic revenue growth in Europe.
Margin Analysis
Gross profit in the quarter came in at $347.8 million, up 2.2% year over year. Adjusted gross margin, as a percentage of revenues, was 51%, down 30 bps year over year.
Adjusted operating margin was $146 million, up 5.6% year over year. Adjusted operating margin, as a percentage of revenues, was 20.2% in the quarter, up 50 bps.
Financial Update
In the second quarter, cash and cash equivalents came in at $150 million, down 8% from that of 2018-end level.
During the reported quarter, net cash provided by operating activities stood at $46.9 million, down 35.8% from the year-ago quarter.
2019 Guidance Reiterated
PerkinElmer continues to expect 2019 adjusted EPS in the range of $4.02-$4.07. Notably, the Zacks Consensus Estimate of $4.05 lies within the guided range.
Conclusion
PerkinElmer exited the second quarter on a weak note, with both EPS and revenues missing the consensus mark. Nonetheless, the company witnessed strong performances by its core Diagnostics units in the quarter under review. Strength in reproductive health and immunodiagnostics business lines led to the impressive performance. Modest growth in international markets is also encouraging.
Further, expansion in operating margins buoys optimism. Solid show by Tulip and EUROIMMUN also paints a bright picture.
However, negative currency movements impacted the company’s top line in the quarter under review. Furthermore, PerkinElmer continues its acquisition spree, which increases integration risks.
Zacks Rank
Currently, PerkinElmer carries a Zacks Rank #4 (Sell).
Earnings of Other MedTech Majors at a Glance
Other top-ranked stocks which posted solid results this earning season are Stryker Corporation (NYSE:SYK) , Baxter International Inc. (NYSE:BAX) and Intuitive Surgical, Inc. (NASDAQ:ISRG) .
Stryker delivered second-quarter 2019 adjusted earnings per share of $1.98, beating the Zacks Consensus Estimate by 2.6%. Revenues of $3.65 billion surpassed the Zacks Consensus Estimate by 1.4%. The company carries a Zacks Rank of 2 (Buy). You can see the complete list of today’s Zacks #1 Rank (Strong Buy) stocks here.
Baxter delivered second-quarter 2019 adjusted earnings of 89 cents per share, which surpassed the Zacks Consensus Estimate of 81 cents by 9.9%. Revenues of $2.84 billion outpaced the Zacks Consensus Estimate of $2.79 billion by 1.9%. The company has a Zacks Rank #2.
Intuitive Surgical reported second-quarter 2019 adjusted earnings per share of $3.25, which beat the Zacks Consensus Estimate of $2.85. Revenues were $1.1 billion, surpassing the Zacks Consensus Estimate of $1.03 billion. The company sports a Zacks Rank #1.
Today's Best Stocks from Zacks
Would you like to see the updated picks from our best market-beating strategies? From 2017 through 2018, while the S&P 500 gained +15.8%, five of our screens returned +38.0%, +61.3%, +61.6%, +68.1%, and +98.3%.
This outperformance has not just been a recent phenomenon. From 2000 – 2018, while the S&P averaged +4.8% per year, our top strategies averaged up to +56.2% per year.
PerkinElmer, Inc. (PKI): Free Stock Analysis Report
Intuitive Surgical, Inc. (ISRG): Free Stock Analysis Report
Baxter International Inc. (BAX): Free Stock Analysis Report
Stryker Corporation (SYK): Free Stock Analysis Report
Original post
Zacks Investment Research