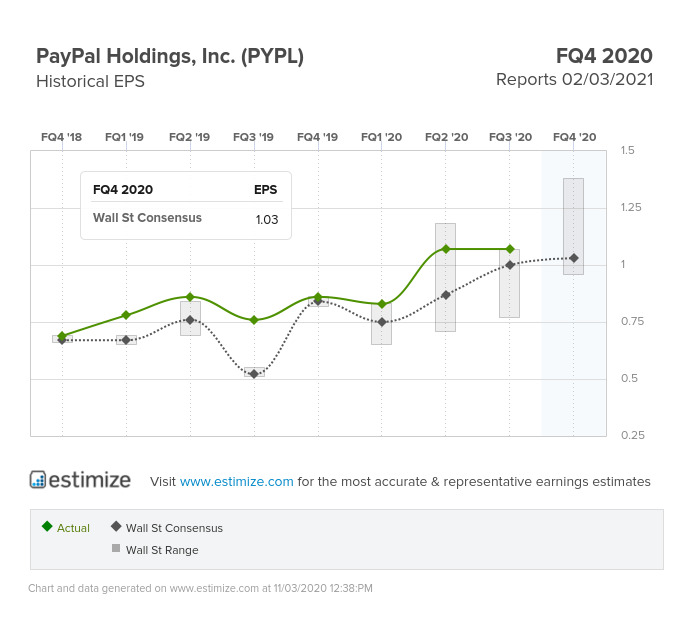
PayPal (NASDAQ:PYPL) reported an historic quarter yesterday. The company beat expectations on earnings (+41% year over year) and a slight beat on revenues (+25% year over year). Record numbers across the board and it was the strongest growth in the company’s history as the pandemic has accelerated the adoption of fintech in ecommerce transactions.
Some other key highlights in the report included:
- 361 million active accounts
- Total Payment Volume (TPV) grew 38% year over year – to $247 billion
- Operating income grew 40% year over year
- Operating Margins improved to 17.9% from 15.9%
- Operating cash flow of $4.61 billion (+40% year over year)
- Full integration of crypto currency on its platform
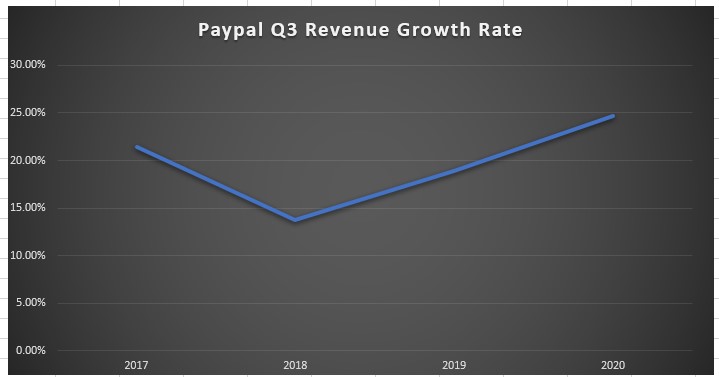
The chart above shows PayPal’s Q3 revenue growth over the last four years.
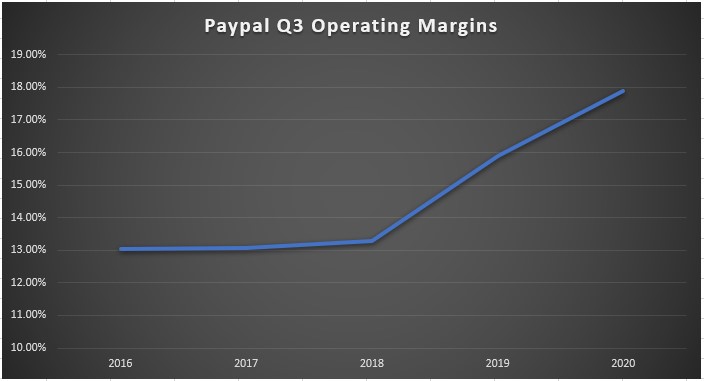
While Q3 operating margins continue to improve dramatically.
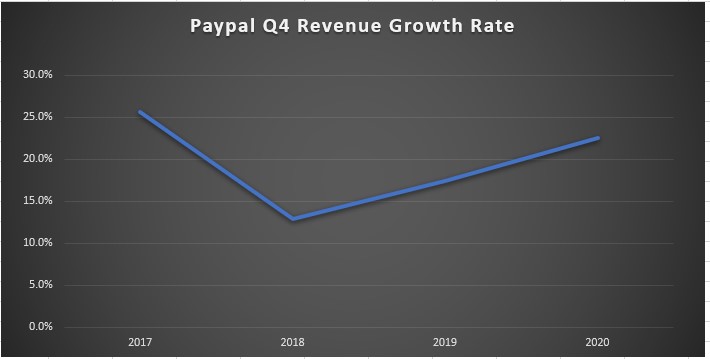
The company’s Q4 guidance was a bit short of expectations. PayPal expects Q4 revenue growth between 20% and 25%, which is still better than the growth rates of 2018 & 2019. They also noted on the conference call that they are experiencing “all-time highest daily payments volume levels in October.” Q4 EPS growth forecast was also below expectations based upon greater investment spending during the holidays. I think that is the main issue in this report.
As I write this, the stock trades down about 4% in overnight trading. PayPal trades 11.5x sales and 42x forward PE, while the stock is up +75% year to date. So, like many of these big tech stocks, a lot of good news was already priced in. Some say the stock is way overvalued, but if you look at a competitor like Square, Square trades 12.5x sales with a growth rate of 30%. Compare this to PayPal that trades 11.5x sales, with a growth rate of 20x, buts its profitable. PayPal has grown GAAP earnings 40% per year over the last 5 years. Even stocks like Mastercard (NYSE:MA) and Visa (NYSE:V) are trading 15x to 18x sales with a lower growth rate than PayPal.
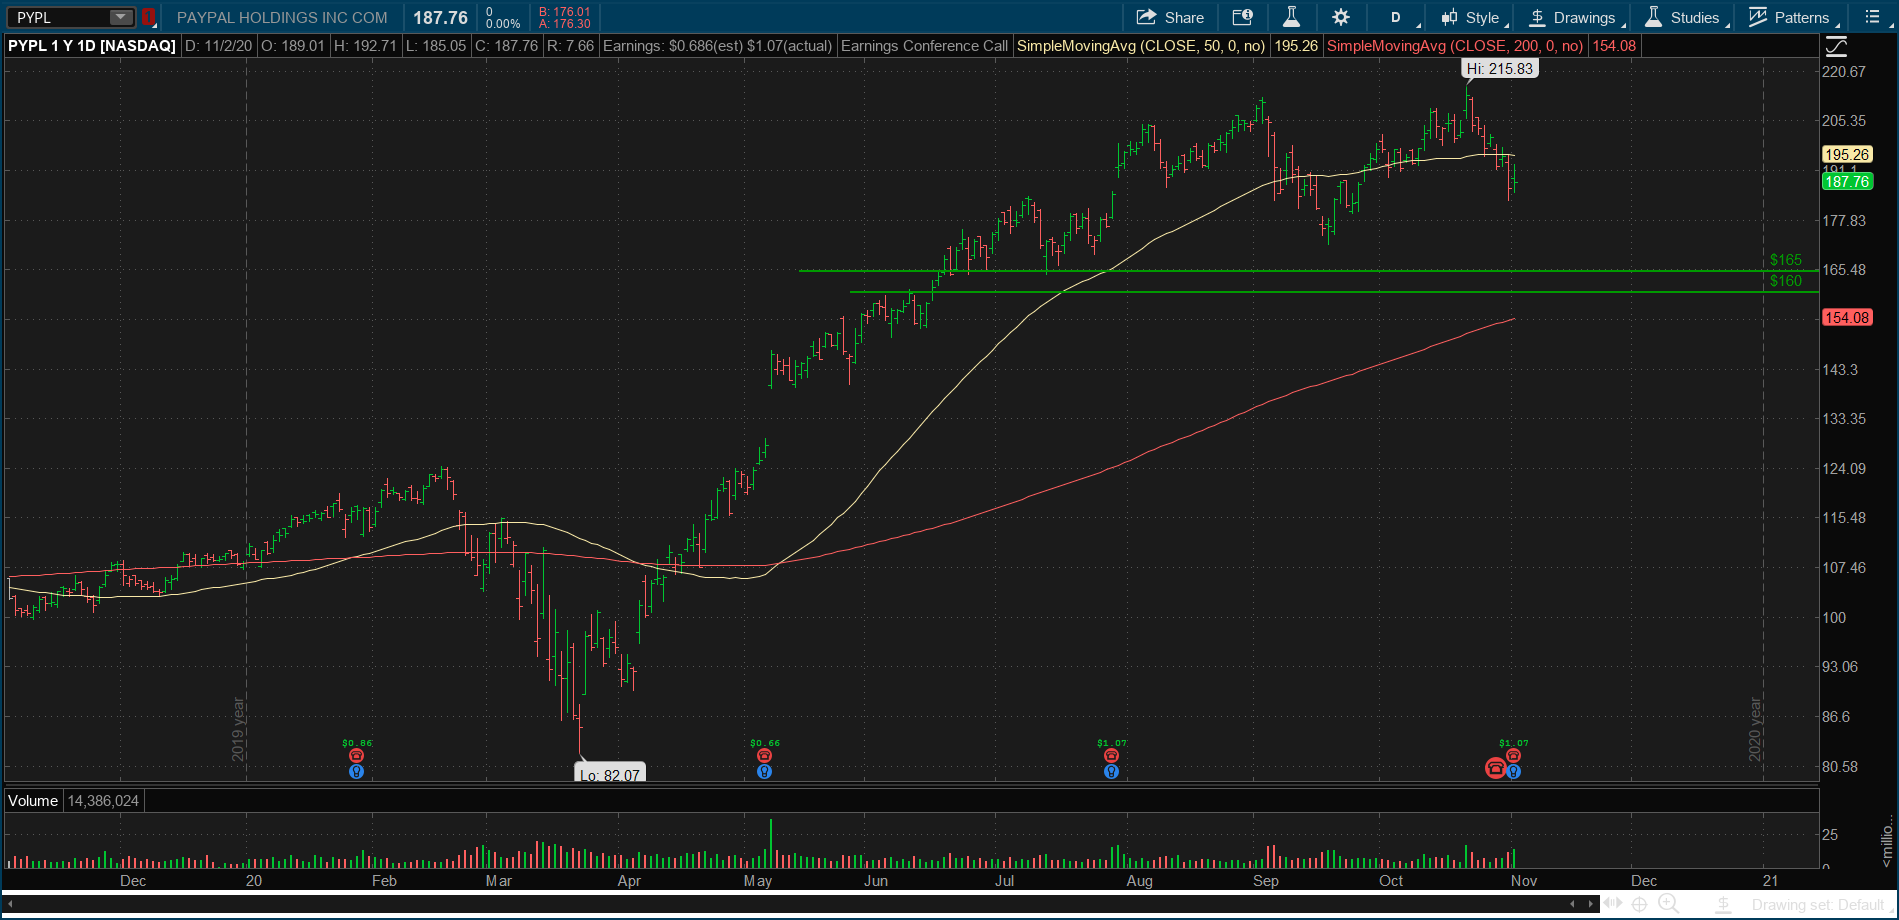
PayPal is another stock I’ve owned for years. I admit I was tempted to take some profits earlier in the year but didn’t. The stock has experienced 6 corrections over the last 5 years – from 13% to 34%. The average decline in the stock price is 21%.
Based on this, and some confluence of potential technical support, I see the $160-$165 area as the level I would add to my position if it ever got there. A lot rides on the direction of the broader market, as PayPal is one of the top names in the Nasdaq 100.
On the economic data front, ISM Manufacturing came in very strong on Monday. I will do a full analysis when the ISM Services report comes out tomorrow. Of course, we’ve got the election tonight, a Federal Reserve statement on Thursday, and the jobs report on Friday. It’s going to be another busy week!
