For traders, one of the hardest disciplines to master is patience and for long-term oil traders that patience is about to be rewarded. As I have suggested in several, more recent posts on oil, following the sharp rally of late August—which was based on high volume—I said we would see an extended phase of price congestion at the current level. This would allow the remnants of selling pressure to be absorbed before the big operators duly moved oil prices higher once again.
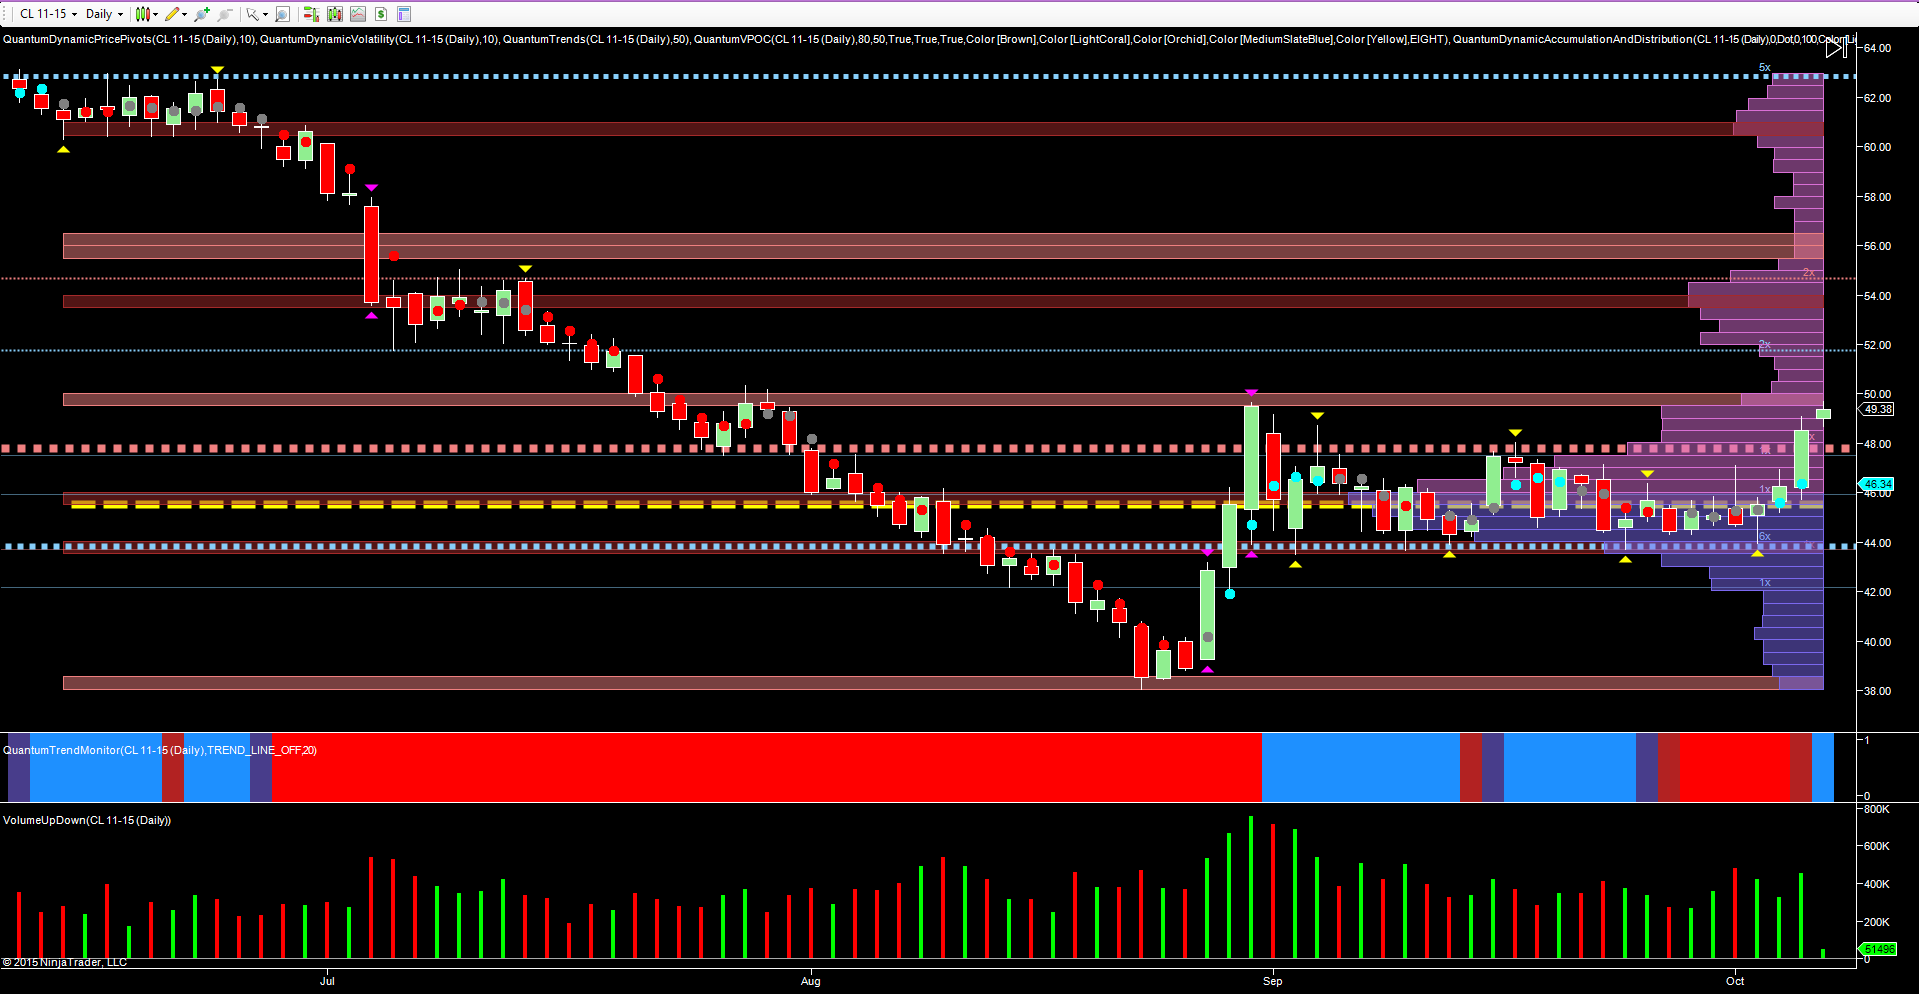
This has indeed been the case with oil prices oscillating in a narrow range, between $44 per barrel to the downside and $48 per barrel to the upside and developing around the volume point of control on the daily chart (as shown by the yellow dotted line). This defines the area of price agreement, and is the fulcrum on which bearish and bullish sentiment has found equilibrium. Any move away from this region then confirms bullish or bearish sentiment accordingly which is why Tuesday’s price action was seminal, with the wide spread up candle on above average volume confirming the build in bullish sentiment and sending a strong signal the breakaway from this region is now underway. Tuesday’s price action was important for another reason, in that the session finally closed well above the deep resistance region in the $48 per barrel area (as defined with the red dotted line), which is now acting as support to the move higher.
This bullish sentiment continued in yesterday’s trading, with prices moving firmly higher off Tuesday night's close at $48.53 per barrel. The question now is how far are we likely to see oil's prices rise, and for that we turn to the volume histogram to the right of the chart, which displays the various levels of low and high volume nodes above and below the fulcrum. As we can see on the daily chart, we have a low volume node immediately ahead in the $50 per barrel area, and as such we can expect to see oil prices move firmly through here in due course, with the next high volume node sitting in the $54 per barrel area, followed by a low volume node at $56 per barrel.
As always, volume will confirm the strength of any move higher, but once we have a clear hold above the $50 per barrel level, this is likely to signal a further move higher, towards the $54 per barrel region.
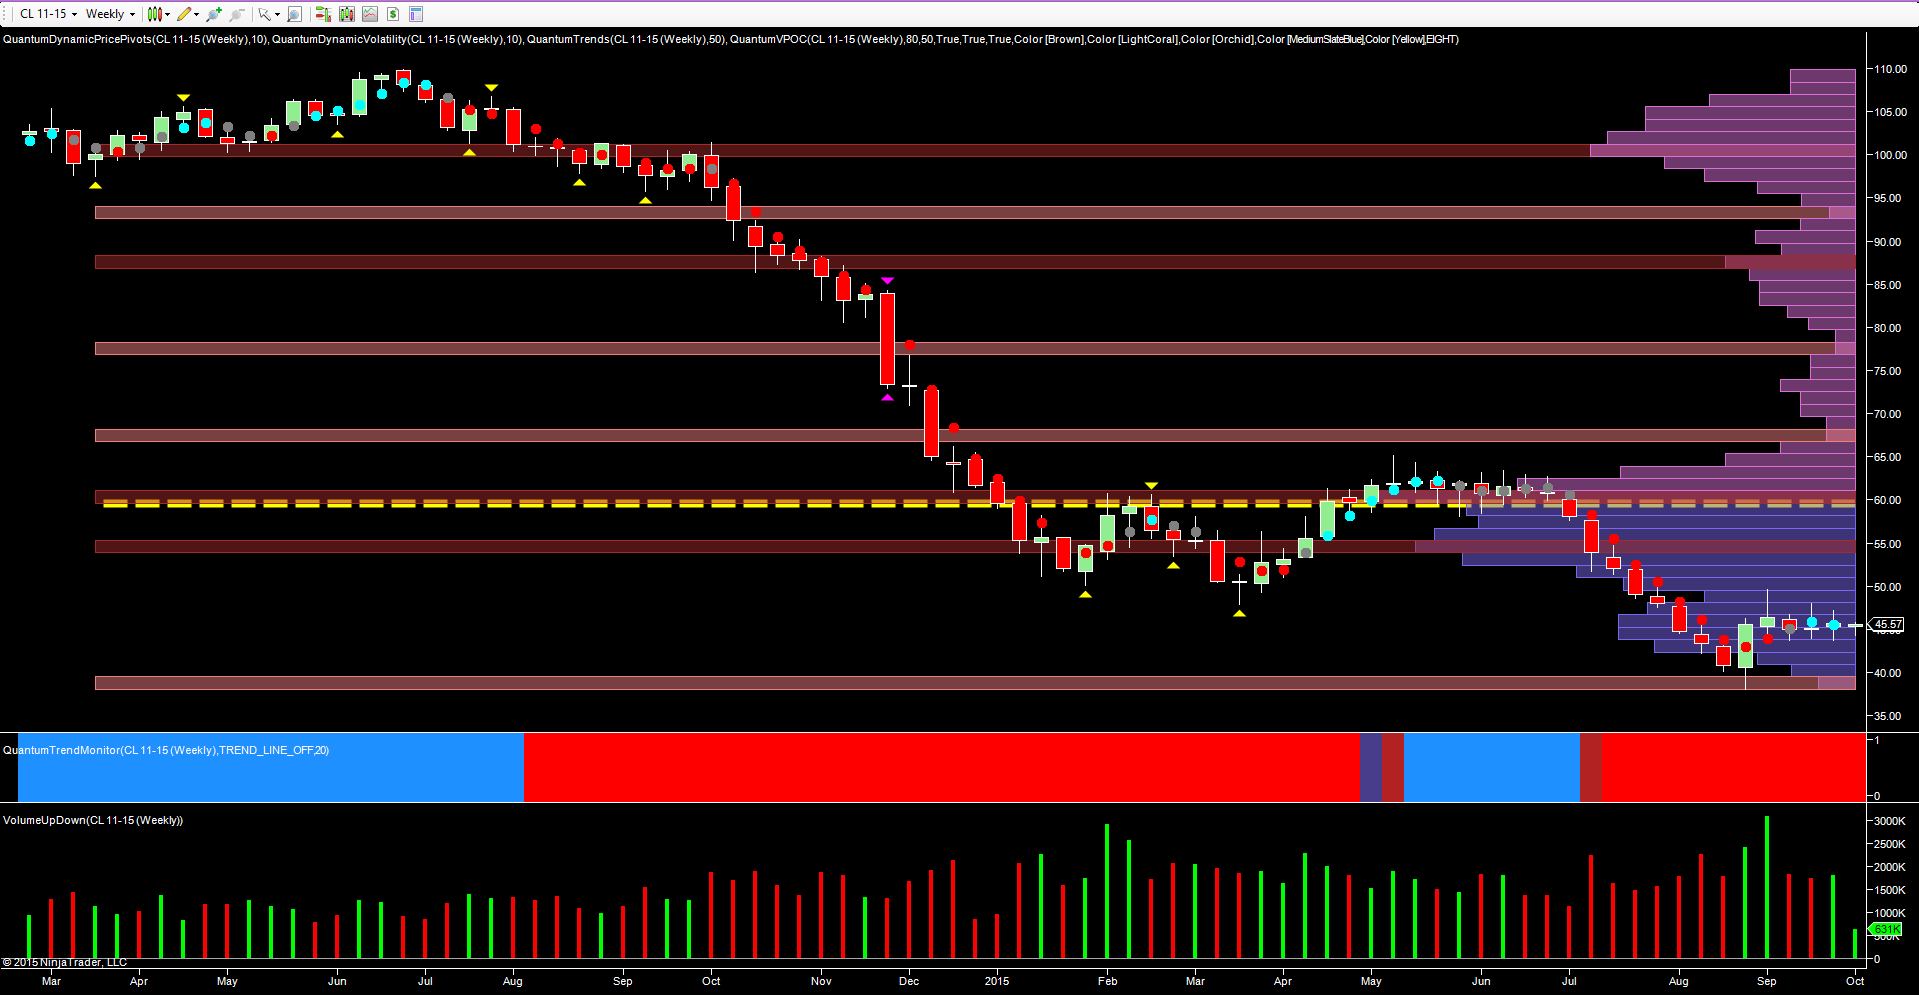
The weekly picture confirms the faster time frame, with the congestion phase of September now beginning to break down as upside momentum develops. Here we can also see the resistance regions again clearly defined, with the VPOC (volume point of control) on this time frame just below the $60 per barrel area, with a high volume node confirming the congestion now awaiting in the $55 per barrel area.
Given this technical picture, we are likely to see oil move firmly higher towards the $54/$55 per barrel area, before the commodity moves into a congestion phase once again, with the $60 per barrel area likely in the longer term. At this point, we can expect to see a further extended consolidation phase as the price action oscillates around price agreement on the VPOC in this time frame.
From a fundamental perspective the weekly oil inventories are suggesting a build once again, with the forecast this week for 2.2m bbls against a previous of 4.0m bbls which may temporarily dent any progress higher. However, given the wild variations in both forecasts and actual, coupled with the swings from a build to a draw, this is unlikely to impact the bullish momentum greatly, and with weakness in the US dollar coupled with rising equities also helping, the outlook for oil prices remains positive.


