Pizza delivery chain Papa John's International (NASDAQ:PZZA) shares spiked, peaked and sold-off making the benchmark S&P 500 appear to be standing still. Restaurants with off-premise and delivery sales channels have weathered the impacts of COVID-19.
Papa John’s business model operates solely through carry-out and delivery channels which makes it a pandemic benefactor. While pizza delivery companies are seen as a pandemic play benefiting from the isolation mandates, Papa John’s is expanding its digital channels with more upside to grow than existing competitors.
Shares may get sold off with the restaurant sector initially in the event of restart rollback, but prudent investors should be aware in this case that restaurants with off-premise sales channels could see a resurgence of buying. The sell-the-news reaction drop in anticipation of economic restarts accelerating is becoming overblown as it sets up opportunistic pullback levels for prudent investors to consider taking long entries into this dual-narrative play.
Q2 FY 2020 Earnings Release
On Aug. 6, 2020, Papa John’s released its second-quarter fiscal 2020 results for the quarter ending June 2020. The Company reported an earnings-per-share (EPS) profit of $0.48 excluding non-recurring items versus consensus analyst estimates for a profit of $0.49, missing estimates by $0.01.
Revenues rose 15.3% year-over-year (YoY) to $460.62 million falling short of the $467.4 million consensus analyst estimates. The Company saw domestic sales increase 28% YoY tempered by international sales increase by 5.3%. Liquidity was ramped up with an additional $400 million secured revolver maturing in August 2022.
Conference Call Takeaways
In the second quarter conference call, the Company highlighted July comparable store sales were up 30% domestically and 14% internationally YoY. The Company generated $67 million of free cash flow for the quarter, up from just $9 million YoY and reduced debt by (-$80 million). The Company has 160 stores temporarily closed internationally.
New product rollouts included Garlic Parmesan Crust, toasted Papadias (pizza quesadillas) and Jalapeno Pepper Rolls. Papa John’s plans to hire over 20,000 new employees. The Company opened 9 restaurants in the U.S. and closed 10 restaurants resulting in (-1) net reduction U.S. location and (-30) net reductions in international locations.
Digital Growth
The investment in digital channels paid off as part of the restructuring efforts started in 2019. The Company saw approximately 70% of all orders placed on digital platforms with mobile being the fastest growing. Digital innovation leverages their loyalty and one-to-one marketing programs. The Company brought in over 3 million new customers over to the digital channels in Q2 2020.
Company Updates
On Aug. 25, 2020, Papa John’s provided a business update reporting sales for the second month of Q3 2020. Domestic company-owned restaurant sales grew 18.1% YoY while franchised U.S. restaurant sales grew 18.1% YoY. System-wide U.S. restaurant sales were up 24.2% while system-wide international sales were up 23.3% YoY for the period of July 27 to Aug.23, 2020.
On Sept. 10, 2020, Papa John’s reported an expanded agreement with franchisor HB Restaurant Group to open 49 new stores in the Philadelphia and southern New Jersey region between 2021 to 2028. Shares may trigger another downdraft to present opportunistic buying opportunities for prudent investors looking to capitalize on both acceleration of restarts and potential for a second wave coronavirus lockdowns which would spur more off-premise meal demand.

Papa Opportunistic Pullback Levels
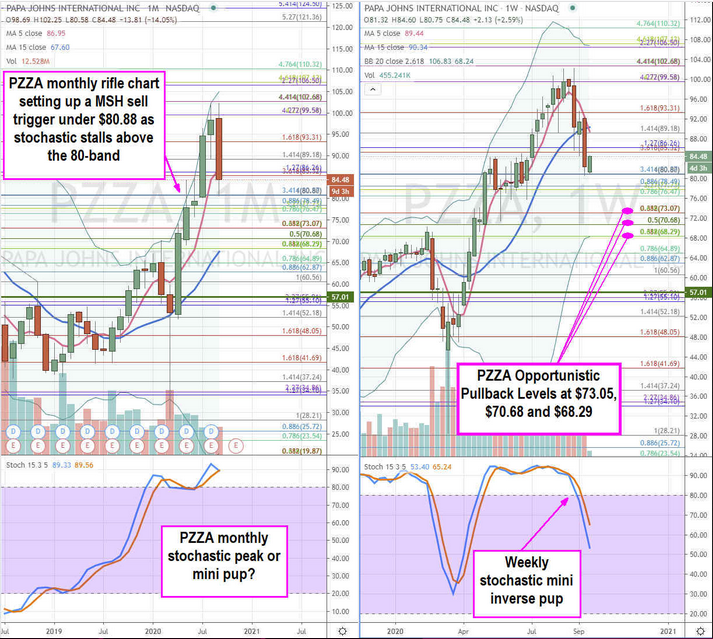
Using the rifle charts on the monthly and weekly time frames provides a broader view of the landscape for NAVI stock. The monthly rifle chart stochastic has stalled near the 90-band setting up a mini pup coil or a peak on a crossover down.
The monthly 5-period moving average (MA) has been breached at $86.95 with the 15-period MA at the $68.29 Fibonacci (fib) level. The monthly and weekly rifle charts triggered a market structure low (MSL) buy above $57.01.
While a reversion bounce to the weekly 5-period MA at $89.18 would be a nominal reversion bounce, a deeper sell-off on a full weekly stochastic oscillation towards 20-band is where the bargain opportunistic pullback levels are at the $73.05 fib, $70.68 fib and $68.20 monthly 15-period MA/weekly lower Bollinger Bands (BBs)/overlapping fib support.
Traders can track PZZA shares with competitor Domino’s Pizza (NYSE: DPZ) as they share the same trajectories.
