Pandora Media, Inc. (Pandora) is an Internet radio in the United States. As of January 31, 2011, it had over 80 million registered users. The Music Genome Project and its playlist generating algorithms enable it to deliver personalized radio to its listeners.
In fact, I’m listening to Pandora right now…
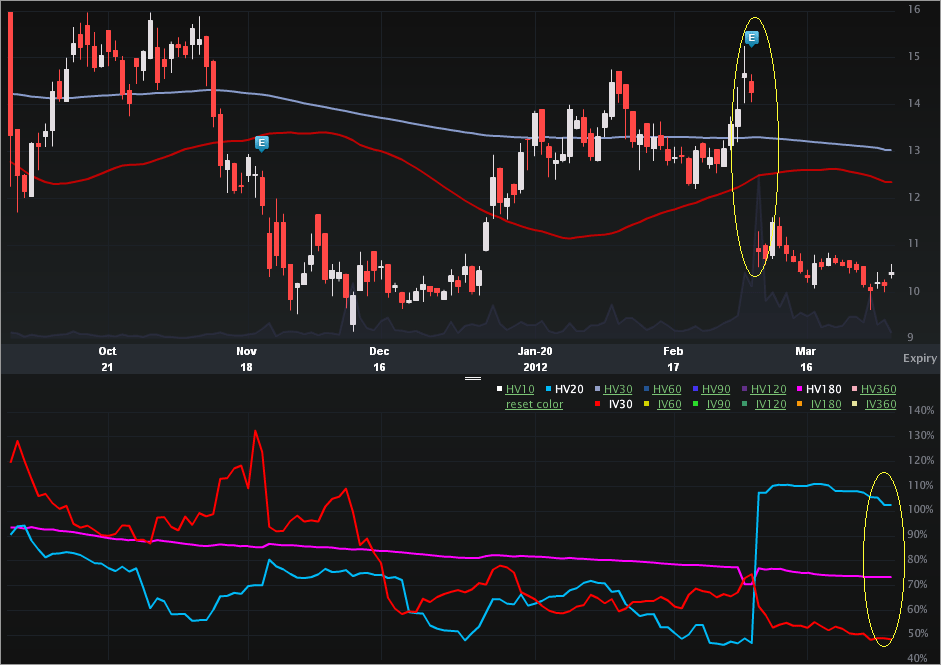
This is a vol note, specifically a new annual low in implied after a cataclysmic earnings move. Let’s start with the Charts tab (six months). The top portion is the stock price, the bottom is the vol (IV30™ - red vs HV20™ - blue vs HV180™ - pink).
The stock chart is rather… bumpy. We can see a rally into the most recent earnings release, and then an implosion after the news. P went from $14.27 down to $10.86 in one day – a 23.9% drop. The stock meandered lower to close at $10.03 on 3-29-2012, and now seems to have found an equilibrium in the mid $10 level. But, ultimately, it’s the vol that caught my eye. Looking to the bottom portion of the chart, we can see how the implied fell off of earnings (normal), and has continued to drop since. The 52 wk range in IV30™ is [48.20%, 132.16%], or in English, the level today is right on an annual low.
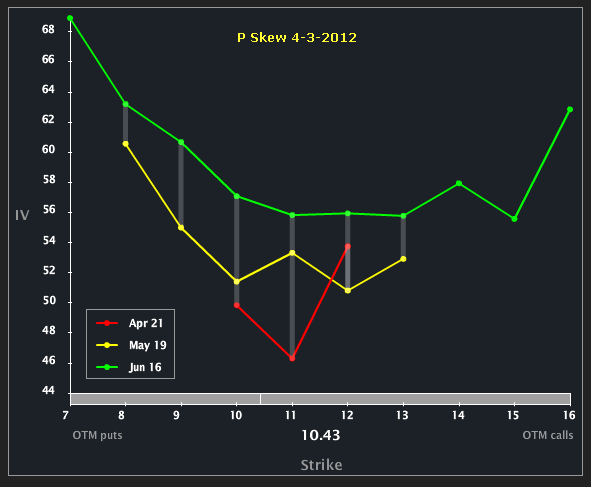
Let’s turn to the Skew Tab to examine the month-to-month and line-by-line vols.
We can see a monotonic vol decrease from the back to the front. The next earnings release is due out in late May. For now, the option market reflects a greater probability that the event will be in the Jun expiry, but outside of May (Friday of expo week is May 18th).
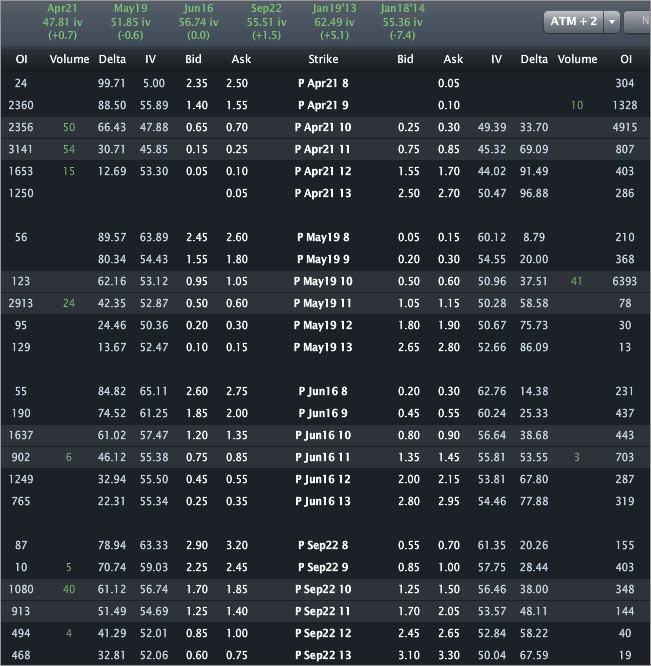
Finally, let’s turn to the Options Tab, for completeness.
I wrote about this one for TheStreet (OptionsProfits), so no specific trade analysis here. Looking across the top of the image we can see the monthly vols are priced to 47.81%, 51.85% and 56.74% for Apr, May and Jun, respectively. Looking back to the Charts Tab, we can see that P has been quite volatile, even without earnings results. The HV180™ is 73.68% -- keep that number in mind relative to the implied vols for each expiry.
This is trade analysis, not a recommendation.
- English (UK)
- English (India)
- English (Canada)
- English (Australia)
- English (South Africa)
- English (Philippines)
- English (Nigeria)
- Deutsch
- Español (España)
- Español (México)
- Français
- Italiano
- Nederlands
- Português (Portugal)
- Polski
- Português (Brasil)
- Русский
- Türkçe
- العربية
- Ελληνικά
- Svenska
- Suomi
- עברית
- 日本語
- 한국어
- 简体中文
- 繁體中文
- Bahasa Indonesia
- Bahasa Melayu
- ไทย
- Tiếng Việt
- हिंदी
Pandora Media (P) - Vol Hits New Low Weeks After Earnings Implosion
Published 04/04/2012, 04:26 AM
Updated 07/09/2023, 06:31 AM
Pandora Media (P) - Vol Hits New Low Weeks After Earnings Implosion
3rd party Ad. Not an offer or recommendation by Investing.com. See disclosure here or
remove ads
.
Latest comments
Install Our App
Risk Disclosure: Trading in financial instruments and/or cryptocurrencies involves high risks including the risk of losing some, or all, of your investment amount, and may not be suitable for all investors. Prices of cryptocurrencies are extremely volatile and may be affected by external factors such as financial, regulatory or political events. Trading on margin increases the financial risks.
Before deciding to trade in financial instrument or cryptocurrencies you should be fully informed of the risks and costs associated with trading the financial markets, carefully consider your investment objectives, level of experience, and risk appetite, and seek professional advice where needed.
Fusion Media would like to remind you that the data contained in this website is not necessarily real-time nor accurate. The data and prices on the website are not necessarily provided by any market or exchange, but may be provided by market makers, and so prices may not be accurate and may differ from the actual price at any given market, meaning prices are indicative and not appropriate for trading purposes. Fusion Media and any provider of the data contained in this website will not accept liability for any loss or damage as a result of your trading, or your reliance on the information contained within this website.
It is prohibited to use, store, reproduce, display, modify, transmit or distribute the data contained in this website without the explicit prior written permission of Fusion Media and/or the data provider. All intellectual property rights are reserved by the providers and/or the exchange providing the data contained in this website.
Fusion Media may be compensated by the advertisers that appear on the website, based on your interaction with the advertisements or advertisers.
© 2007-2024 - Fusion Media Limited. All Rights Reserved.
