
Headline earnings for Pan African Resources (LON:PAFR) in FY19 were within US$0.14m of our prior expectations, after a 54% increase in gold produced from continuing operations combined with a 27% decline in AISC to result in a 75.3% increase in underlying EBITDA. Guidance for FY20 remains unchanged at 185,000 (albeit higher margin) ounces cf guidance of 170koz until May, supporting our headline EPS forecast of 2.46 US cents per share (cf 1.88p/share previously). Investors should note the change in PAF’s accounts from sterling to US dollars.
Guidance appears solid
Group-wide production of 48,671oz in Q419 was materially stronger than any of the other quarters in FY19 and, alone, would imply c 195koz of production on an annualised basis. In the meantime, PAF’s production guidance of 185,000oz for FY20 is supported by a full year’s contribution from Elikhulu, which will add an additional c 16,132–18,799oz to group production, plus a c 20,000oz maiden contribution from the Evander 8 Shaft pillar project, replacing 16,879oz of low/negative margin production from sweeping and vamping operations.
Dividend to increase as PAF ‘harvests’ profits
Pre-financing cash flow turned positive in H219 as capex more than halved (from ZAR585.9m in H119 to ZAR216.1m in H219) and we also expect it to halve in FY20 cf FY19. As a result, henceforward, we expect PAF to become strongly cash-generative, such that it will pay down net debt at the same time as increasing dividend distributions.
Valuation: 24.07 US cents plus 19.2Moz
Including the Evander 8 Shaft pillar project, our headline absolute valuation of PAF has increased from 14.05p/share to 17.89c/share. This increases to 24.07c/share (cf 19.00p previously) once growth projects and other assets have been taken into account, plus the value of c 19.2m underground Witwatersrand ounces, which could lie anywhere in the range of 0.22–5.24c per share, depending on market conditions. In the meantime, if PAF’s historical average price to normalised EPS ratio of 9.6x in the period FY10–19 is applied to our respective forecasts, its share price could be expected to be 18.9p in FY20, rising to 28.9p in FY21. Pan African also remains cheaper than its South African- and London-listed gold mining peers on at least 83% of common valuation measures regardless of whether Edison or consensus forecasts are used. Finally, based on our assumptions, its dividend yield in FY20 should be within the top third of the 52 precious metals companies expected to pay a dividend over the next 12 months (see Exhibit 12 on page 11), rising again in FY21.
Share price performance
Business description
Pan African Resources has three major producing precious metals assets in South Africa: Barberton (target output 95koz Au pa), the Barberton Tailings Retreatment Project, or BTRP (20koz), and Elikhulu (55koz), now incorporating the Evander Tailings Retreatment Project, or ETRP (10koz).
FY results to 30 June 2019
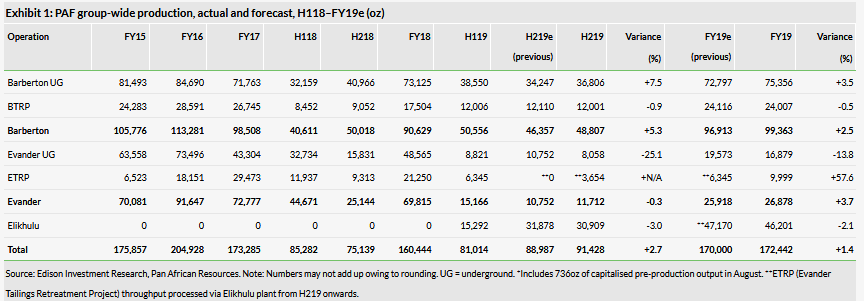
Pan African’s results for the full year to end-June 2019 were reported within the context of the group having outperformed its own production guidance (and Edison’s prior expectations) by 1.4% in aggregate, after especially strong performances at Barberton and Evander’s underground operations:
While overall production did not match the record performance reported in FY16, it was consistent with FY15 and FY17 and 7.5% higher than FY18, after only a partial contribution from Elikhulu – thereby confirming management’s assertion of a year ago that production from Elikhulu would largely make up for production lost from the closure of large-scale underground operations at Evander. Highlights for the period were as follows:
A 54.1% increase in the production of gold from continuing operations.
A 2.7% decline in the average price of gold received by the group in US dollar terms, from US$1,301/oz to US$1,266/oz.
A 10.4% decline in the US$/ZAR exchange rate, from ZAR12.85/US$ to ZAR14.19/US$.
A 15.4% decline in cash costs in rand terms, from ZAR480,439/kg to ZAR406,466/kg, which translated into a 23.3% decline in dollar terms, from US$1,162/oz to US$891/oz.
A sharp decline in capex, from ZAR585.9m (US$41.3m) in H119 to ZAR216.1m (US$15.2m) in H219.
A US$17.9m reversal of a total impairment charge of US$140.3m made in May 2018, relating to Evander Mines’ 8 Shaft infrastructure following the decision to implement the 8 Shaft pillar project.
Throughput of 1.3Mt in the month of March at Elikhulu (100,000t above nameplate capacity), while total cash costs for the year were within 10% of those projected in the feasibility study, at US$555/oz.
Production at the Barberton Tailings Retreatment Project (BTRP) increased by 37.2% compared to FY18, taking output back to levels that were typical in FY15–17, following the successful commissioning of the 1.7MW BTRP regrind mill in May 2018 that has allowed it to efficiently treat coarser fraction tailings, such as the older (albeit lower-grade) Harper dumps for processing.
Zero fatalities in FY19 (as well) as FY18, with 1 million fatality free shifts at Fairview and 2 million fatality free shifts at Barberton, while the group’s lost-time injury frequency rate improved substantially, to 1.62 per million man hours (cf 3.73 in FY18, 1.75 in H119 and 3.79 in H118), and its reportable injury frequency rate improved to 0.51 per million man hours (cf 1.08 in FY18, 0.58 in H119 and 1.17 in H118).
A sharp increase in underground production at Barberton in Q4 in particular (see Exhibit 2, below) under the influence of three cycling production platforms, which, in conjunction with a concurrent increase in development rates, have materially increased mining flexibility.
A resumption of dividend payments after a hiatus in FY18 (and subject to approval at the company’s AGM on 28 November), with the board proposing a final dividend of ZAR50m for FY19, or approximately US$3.4m, ZAR0.0223745/share, or 0.15169 US cents per share, or 0.12660p per share.
A summary of PAF’s production profile, by quarter, is as follows:
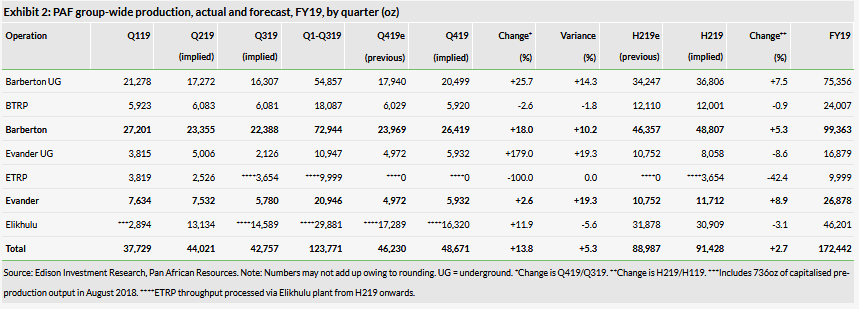
Investors should note that four quarters of production at the Q4 level of 48,671oz per quarter would imply group production in FY20 of 194,684oz – ie 5.2% above current management guidance (see below).
FY19 actual versus expected
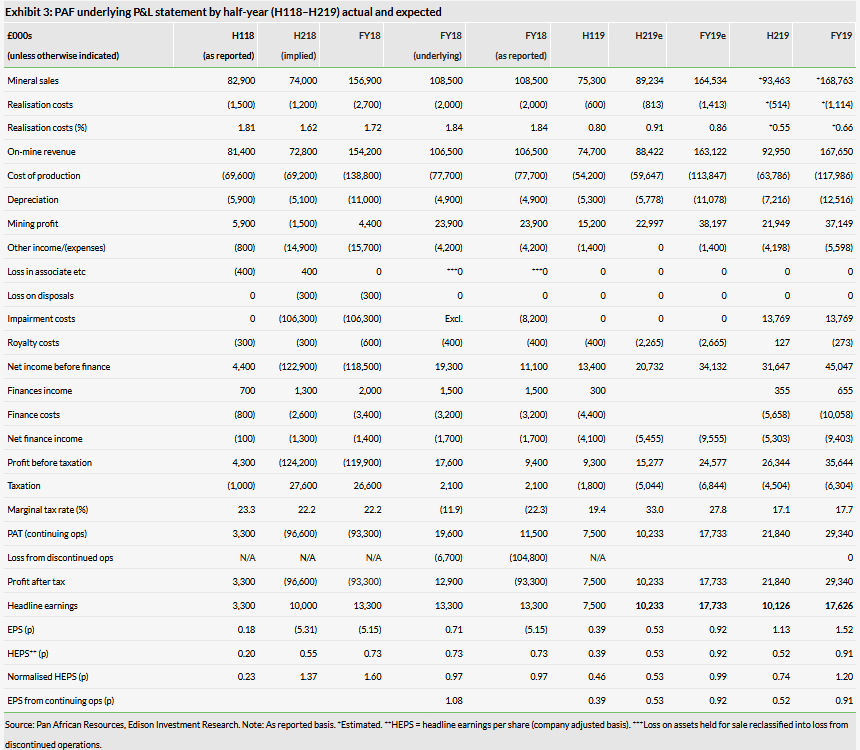
Consistent with a number of statements throughout the year, Pan African changed its reporting currency in the year to end-June 2019 from pounds sterling to US dollars. The table below converts PAF’s results back into sterling terms for the purposes of comparison with our prior forecasts and FY18 in particular.
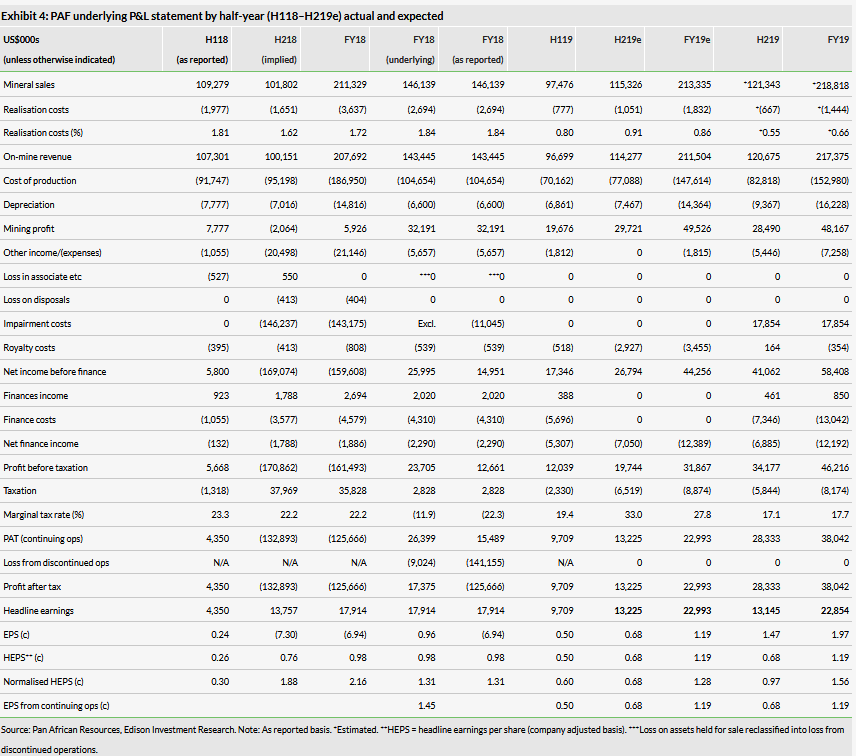
The table below, by contrast, presents PAF’s results, as reported, with FY18 results (and our prior expectations) converted from sterling to US dollar terms:
In both cases the main differences between our forecasts and the actual outcome for FY19 were the US$17.9m impairment reversal relating to Evander Mines’ 8 Shaft infrastructure and ‘other’ expenses, which included the group’s cash-settled share option costs (which Edison typically declines to attempt to forecast). Excluding exceptional and one-off items, Edison’s HEPS forecasts for H219 and FY19 (highlighted) were within £150,000 of those actually reported.
Inflation (or not)
Relative to the 54.1% increase in its gold production from continuing mining operations, the group’s cost of production from continuing operations (see columns entitled ‘FY18 (underlying)’ and ‘FY18 (as reported)’ in Exhibit 4) increased by only 42.9% in US dollar terms. Within this:
Salaries & wages (30.3% of the total) increased by 11.5%.
Mining & processing (41.1% of the total) increased by 74.4%, among other things, reflecting a 277% increase in the total tonnage of material milled and processed.
Electricity (12.0% of the total) increased by 77.7%.
Engineering & technical costs (7.8% of the total) increased by 56.9%.
Security costs (4.7% of the total) increased by 71.4%, owing to an increased focus on combating illegal mining activities and one-off costs incurred during instances of community unrest.
H219 vs H119 analysis and beyond
In the wake of the closure of large-scale underground mining operations at Evander in May 2018, Pan African’s two most important producing assets are Barberton underground (42% of Q419 production) and Elikhulu (34%).
An analysis of Barberton underground’s H219 performance, relative to H1 plus our expectations for FY20, by half-year, is provided in Exhibit 5, below. Of note, within this context, is the decline in underground tonnes milled in H219. This was augmented by tonnes milled from surface sources and PAF indicates that c 5,000oz will be produced from surface sources in FY20. The inclusion of surface sources also helped to keep cash costs (measured in ZAR/t) low in H219. Nevertheless, after an implied ZAR132.5m in capex, it is likely that Barberton’s net cash flow in H219 was negative. Our forecasts for FY20 assume that underground operations at Barberton return to their previous levels in terms of both tonnes milled and head grade. This is consistent with production in Q419 (see Exhibit 2, above), but is slightly ahead of official guidance of 80,000oz of production for FY20 – albeit this is balanced by our expectations at Elikhulu (see below).
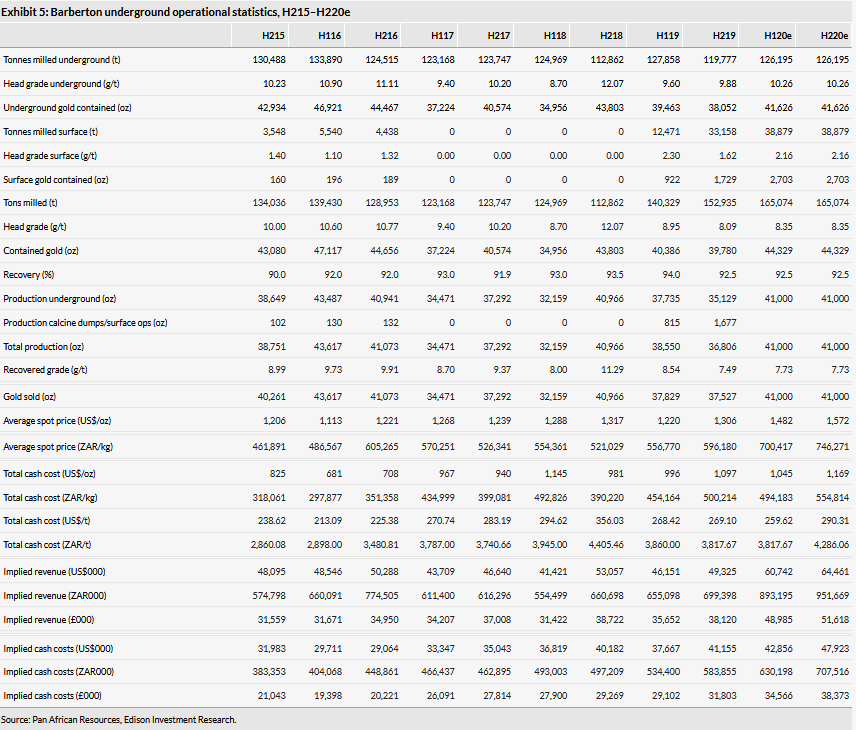
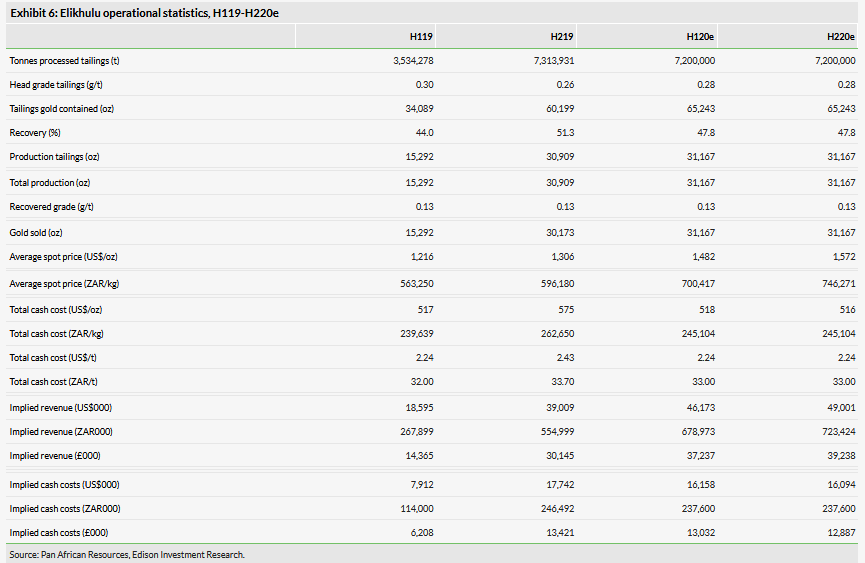
Exhibit 6 similarly provides our analysis of Elikhulu’s H219 performance compared with H1 and also our expectations for H120 and H220. Of note is the above-nameplate throughput in H219 and the higher than expected metallurgical recoveries, but slightly lower head grade. We expect FY20 to be characterised by full-capacity throughput, a recovery in grade and a small decline in total cash costs (in ZAR/t terms). For the moment, we are assuming a return to the average levels of metallurgical recovery anticipated in the project’s feasibility study, such that output is 62,334oz for the 12-month period. This is slightly lower than official guidance of 65,000oz for the complex for the year, but may be easily made up by either a higher metallurgical recovery (eg in line with H219) or a higher head grade (eg in line with H119). Investors should note that, inasmuch as our output expectations for Elikhulu are slightly below official guidance, they are balanced by output expectations that are slightly above official guidance at Barberton (above) and, in aggregate, are conservative in that they assume higher production from the lower margin operation and vice versa.
Apart from Barberton and Elikhulu, the BTRP (12% of production in Q419) performed closely in line with both our expectations and H119 (but materially ahead of FY18 and most previous years of operation), following the successful commissioning of a 1.7MW BTRP regrind mill in May 2018 that has allowed it to efficiently treat coarser fraction tailings, such as the older (albeit lower-grade) Harper dumps for processing. At the same time, we estimate that 85.4kt of material from surface feedstocks was treated through ETRP infrastructure in H219, which, at a head grade of 2.62g/t and after metallurgical recovery of 50.9%, resulted in the production of 3,654oz gold – demonstrating, among other things, the flexibility that Pan African has developed in processing such feedstocks (from either internal or external sources) now that the ETRP’s primary material stream has been diverted through the expanded Elikhulu plant.
Evander 8 Shaft pillar project
In its operational update for the nine months ended 31 March 2019, released on 17 May, Pan African confirmed that the feasibility study on the Evander 8 Shaft pillar project had been completed and that the board of directors had sanctioned its development. Whereas Edison had originally assumed that commercial production from this project would not be achieved until after the end of FY20, in fact development and equipping of this area of the mine is now in progress and first gold has already been poured – effectively replacing production from the remnant underground mining and vamping operations that had been ongoing at Evander since the decision to close large-scale operations there in May 2018 (see Exhibit 1). PAF expects the 8 Shaft pillar project to contribute, on average, 30,000oz of production per annum to the group over the next three financial years, including c 20,000oz in FY20.
A summary of the (updated) results of the Evander 8 Shaft pillar project feasibility study are as follows:
initial capex of ZAR40.0m;
total capex of ZAR70.0m;
throughput rate of 11.5ktpm producing 30koz per annum, on average, with peak production of 39koz in the second year of operations;
an average all-in sustaining cost (AISC) of approximately ZAR415,000/kg, or US$900/oz over the life of the project (assuming a forex rate of ZAR14.30/US$);
a three-year life-of-mine; and
a project pre-tax NPV of US$25.8m, or 1.3 US cents per share, at a 10% real discount rate and an assumed gold price of ZAR600,000/kg, or US$1,305/oz.
Critical to the success of the project is the requirement to de-stress the orebody while mining is underway, to which end Pan African has already commissioned a backfill plant at surface with the ability to pump a mixture of concrete and waste rock underground to selectively support areas of the orebody.
FY20
A comparison of Edison’s forecasts for FY20 compared with official guidance is as follows:

As noted previously, inasmuch as our output expectations for Elikhulu are slightly below official guidance, they are balanced by output expectations that are slightly above official guidance at Barberton (above) and, from a financial perspective, may be considered conservative in that they assume higher production from the lower-margin operation and vice versa.
Gold price
In addition to our output forecasts, we have also adjusted our gold price assumptions to those set out in our recent report, Portents of economic weakness: Gold – doves in the ascendant, published on 14 August 2019. The principal near-term changes to our forecasts are provided in Exhibit 8 below:

Debt service and covenant compliance guarantees
Pan African has two forms of relatively modest hedging contracts currently in place solely for the purposes of guaranteeing debt serviceability and covenant compliance. The first is a gold loan of 20,000oz that locks in a gold price of approximately ZAR633,347/kg (US$1,415/oz), representing approximately 11% of the group’s anticipated production for the 2020 financial year. The second is a series of zero cost collar contracts over 29,550oz gold in H120 and 50,400oz gold in H220 that cap the likely gold price received by Pan African at ZAR666,000/kg (c US$1,403/oz) and ZAR836,000/kg (c US$1,761/oz), respectively, but also floor it at ZAR604,000/kg (c US$1,272/oz) and ZAR655,000/kg (c US$1,379/oz), respectively.
Given our current gold price expectations (see Exhibit 8), we do not expect the call options written at ZAR836,000/kg to be exercised in H220. However, we do expect the ones written at ZAR666,000/kg to be exercised, which, together with the gold loan, we expect to result in a loss of US$4.6m in FY20, which we have included in ‘other income/(expenses)’.
Updated valuation
As noted previously, Pan African changed its reporting currency in the year to end-June 2019 from pounds sterling to US dollars. As a result, all of Edison’s historical results and future forecasts have been restated into US dollars, and should therefore not be directly compared with previous notes on the company except via the application of the appropriate foreign exchange rate.
Updating our long-term forecasts to reflect our revised gold prices and prevailing forex rates in particular, our normalised headline earnings per share (HEPS) forecast has risen fractionally, to 2.46c/share (cf 1.88p/share previously). This compares with a consensus EPS forecast of 3.47c/share, within a range 2.31–5.15c/share (source: Refinitiv, 2 October 2019). At the same time, we have introduced formal forecasts for FY21 for the first time, based on production of 216.3koz, including 94.6koz for Barberton underground and 36.7koz from the Evander 8 Shaft pillar project. In this case, our normalised HEPS forecast for FY21 is 3.75 US cents and compares with a consensus of 3.73c, within a range 2.95–4.54c (source: Refinitiv, 2 October 2019).
In the meantime, our absolute value of PAF (based on its existing four producing assets only) has increased from 14.05p/share in June to 17.89c/share (ex-div) currently, based on the present value of our estimated maximum potential stream of dividends payable to shareholders over the life of its mining operations (applying a 10% discount rate):