
Yesterday I detailed a paired switching portfolio allocation strategy using SPY (SPDR S&P 500) and TLT (iShares Barclays 20 Year Treasury Fund) and offered back test results dating to 2003. Based on the feedback I received there is interest in the strategy so I decided to test different pairs of ETFs using the same metrics as yesterday's tests.
The limitation of the tests are primarily the time frame - most ETFs have relatively short trading histories so it is difficult to draw strong conclusions on the historical merits of the strategy. Nevertheless, the system shows some signs of promise as a simple paired strategy using non-correlated ETFs. The most promising results of the pairs tested is a natural resource/long-term treasury pair.
Test 1 - EFA (iShares MSCI EAFE Index Fund) and TLT
First, we began with the 3 month relative strength results. The ETF which had the highest 3 month relative strength among the two was purchased each month (monthly re-balance). For the sake of consistency, I used SPY as the benchmark for all tests:
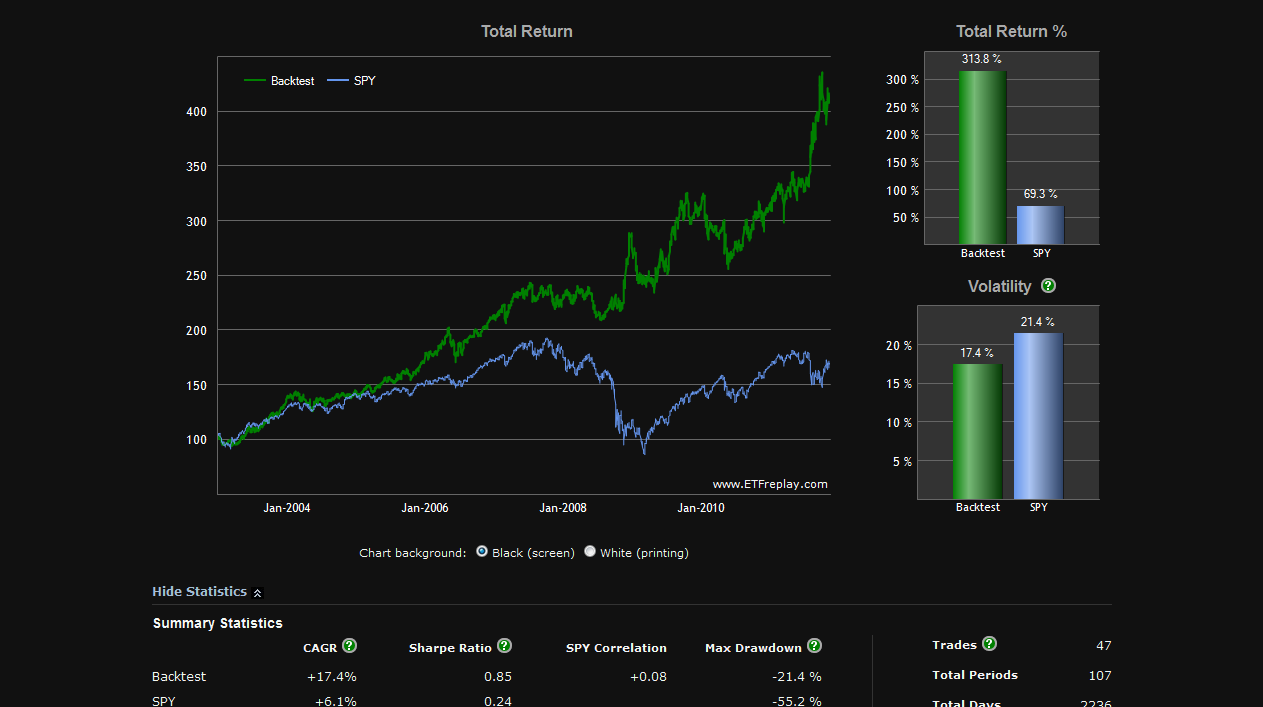
Trades CAGR Sharpe Ratio SPY Correlation Max Drawdown
47 Backtest 17.40% 0.85 0.08 -21.40%
Total Periods SPY 6.10% 0.24 -55.20%
107
Total Days
2236
Next, we perform the same test using 6 month relative strength ranking to determine the ETF position. The results are below for EFA and TLT:

Trades CAGR Sharpe Ratio SPY Correlation Max Drawdown
27 Backtest 12.70% 0.61 0.09 -26.00%
Total Periods SPY 6.10% 0.24 -55.20%
107
Total Days
2236
Test 2 - SPY and SH (ProShares Short S&P 500)
For this test, SH began trading in 2006 so the results are more limited.
The 3 month relative strength results:
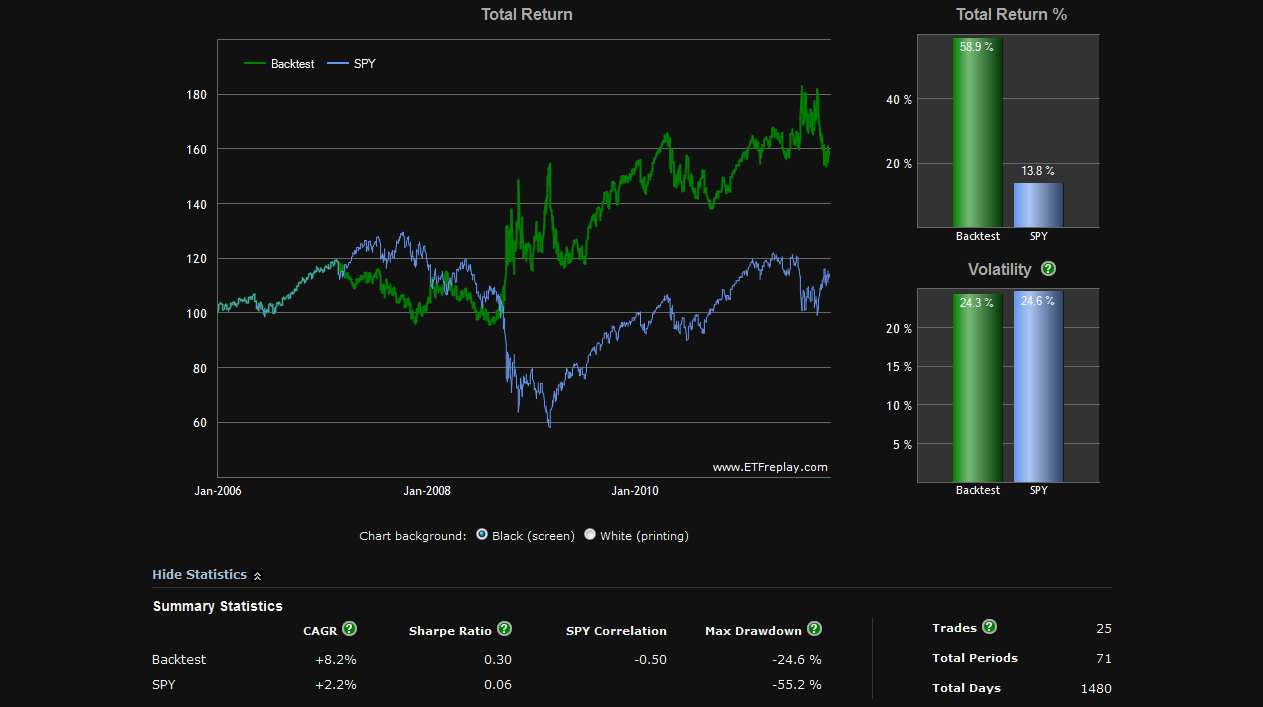
Trades CAGR Sharpe Ratio SPY Correlation Max Drawdown
25 Backtest 8.20% 0.3 -0.5 -24.60%
Total Periods SPY 2.20% 0.06 -55.20%
71
Total Days
1480
The 6 month relative strength results:

Trades CAGR Sharpe Ratio SPY Correlation Max Drawdown
15 Backtest 5.80% 0.21 -0.4 -39.30%
Total Periods SPY 2.20% 0.06 -55.20%
71
Total Days
1480
Test 3 - SPY and SHY (iShares Barclays 1-3 Year Treasury)
The 3 month relative strength results:
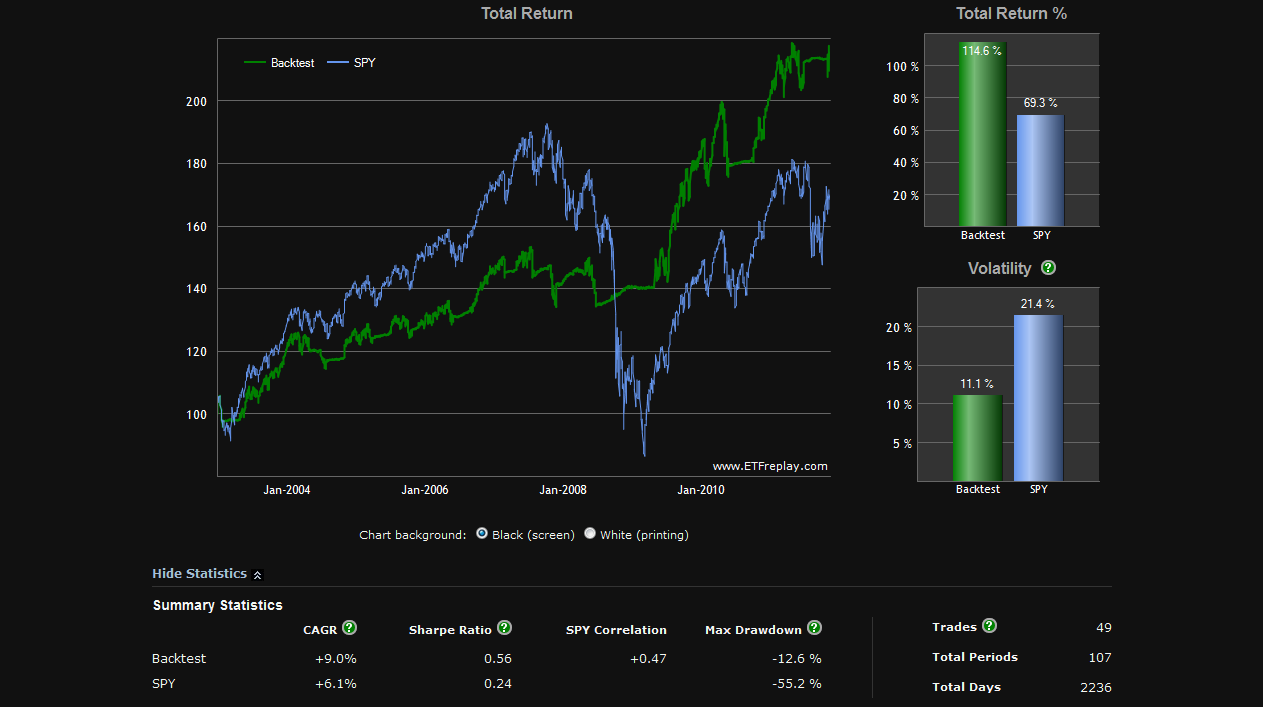
Trades CAGR Sharpe Ratio SPY Correlation Max Drawdown
49 Backtest 9.00% 0.56 0.47 -12.60%
Total Periods SPY 6.10% 0.24 -55.20%
107
Total Days
2236
Next, the 6 month relative strength results for SPY and SHY:
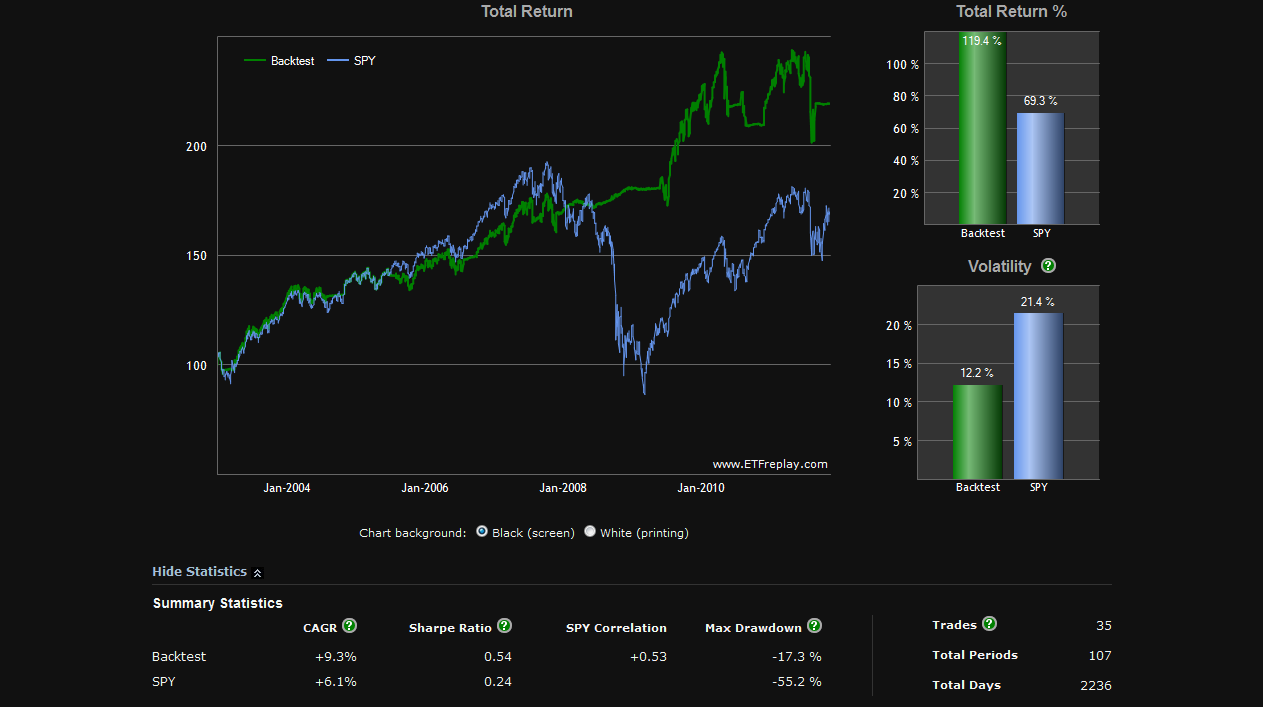
Trades CAGR Sharpe Ratio SPY Correlation Max Drawdown
35 Backtest 9.30% 0.54 0.53 -17.30%
Total Periods SPY 6.10% 0.24 -55.20%
107
Total Days
2236
Test 4 - IGE (iShares S&P North American Natural Resources ) and TLT
Perhaps the most intriguing results of the four tests is the pair of IGE and TLT. First, the 3 month relative strength test results:
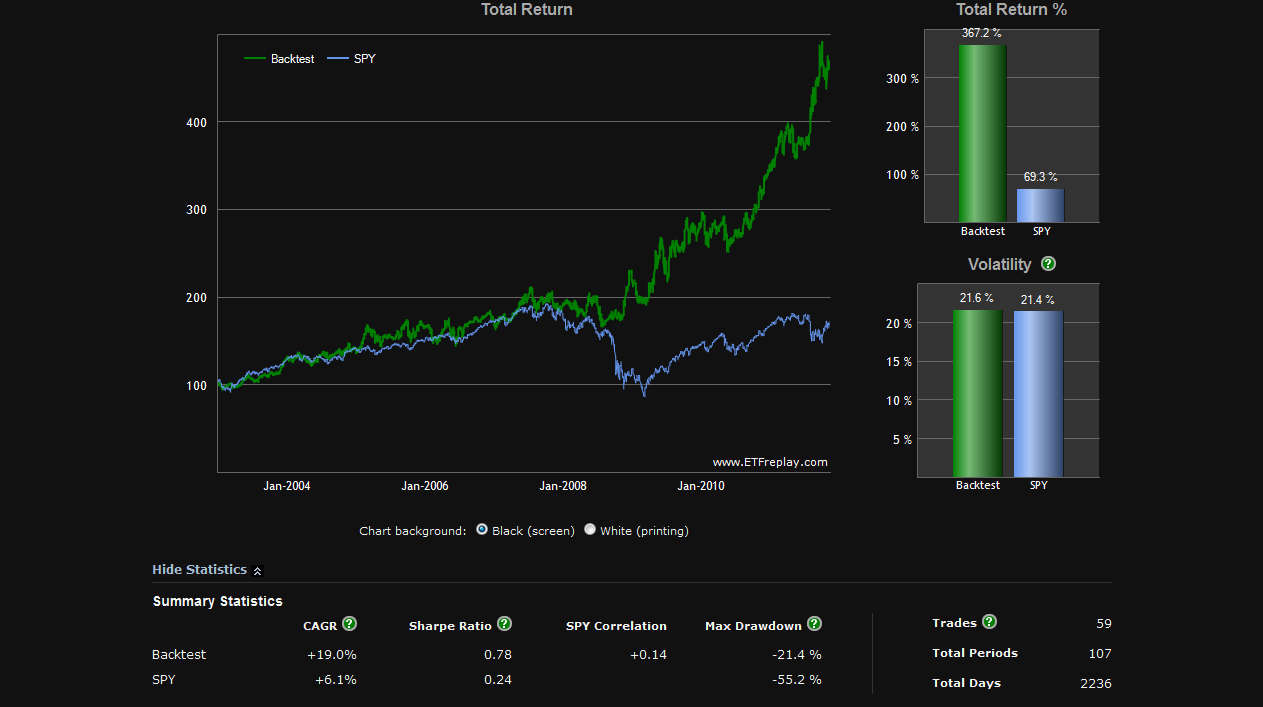
Trades CAGR Sharpe Ratio SPY Correlation Max Drawdown
59 Backtest 19.00% 0.78 0.14 -21.40%
Total Periods SPY 6.10% 0.24 -55.20%
107
Total Days
2236
The 6 month relative strength results:

Trades CAGR Sharpe Ratio SPY Correlation Max Drawdown
35 Backtest 18.00% 0.73 0.14 -31.40%
Total Periods SPY 6.10% 0.24 -55.20%
107
Total Days
2236
The limitation of the tests are primarily the time frame - most ETFs have relatively short trading histories so it is difficult to draw strong conclusions on the historical merits of the strategy. Nevertheless, the system shows some signs of promise as a simple paired strategy using non-correlated ETFs. The most promising results of the pairs tested is a natural resource/long-term treasury pair.
Test 1 - EFA (iShares MSCI EAFE Index Fund) and TLT
First, we began with the 3 month relative strength results. The ETF which had the highest 3 month relative strength among the two was purchased each month (monthly re-balance). For the sake of consistency, I used SPY as the benchmark for all tests:
Trades CAGR Sharpe Ratio SPY Correlation Max Drawdown
47 Backtest 17.40% 0.85 0.08 -21.40%
Total Periods SPY 6.10% 0.24 -55.20%
107
Total Days
2236
Next, we perform the same test using 6 month relative strength ranking to determine the ETF position. The results are below for EFA and TLT:
Trades CAGR Sharpe Ratio SPY Correlation Max Drawdown
27 Backtest 12.70% 0.61 0.09 -26.00%
Total Periods SPY 6.10% 0.24 -55.20%
107
Total Days
2236
Test 2 - SPY and SH (ProShares Short S&P 500)
For this test, SH began trading in 2006 so the results are more limited.
The 3 month relative strength results:
Trades CAGR Sharpe Ratio SPY Correlation Max Drawdown
25 Backtest 8.20% 0.3 -0.5 -24.60%
Total Periods SPY 2.20% 0.06 -55.20%
71
Total Days
1480
The 6 month relative strength results:
Trades CAGR Sharpe Ratio SPY Correlation Max Drawdown
15 Backtest 5.80% 0.21 -0.4 -39.30%
Total Periods SPY 2.20% 0.06 -55.20%
71
Total Days
1480
Test 3 - SPY and SHY (iShares Barclays 1-3 Year Treasury)
The 3 month relative strength results:
Trades CAGR Sharpe Ratio SPY Correlation Max Drawdown
49 Backtest 9.00% 0.56 0.47 -12.60%
Total Periods SPY 6.10% 0.24 -55.20%
107
Total Days
2236
Next, the 6 month relative strength results for SPY and SHY:
Trades CAGR Sharpe Ratio SPY Correlation Max Drawdown
35 Backtest 9.30% 0.54 0.53 -17.30%
Total Periods SPY 6.10% 0.24 -55.20%
107
Total Days
2236
Test 4 - IGE (iShares S&P North American Natural Resources ) and TLT
Perhaps the most intriguing results of the four tests is the pair of IGE and TLT. First, the 3 month relative strength test results:
Trades CAGR Sharpe Ratio SPY Correlation Max Drawdown
59 Backtest 19.00% 0.78 0.14 -21.40%
Total Periods SPY 6.10% 0.24 -55.20%
107
Total Days
2236
The 6 month relative strength results:
Trades CAGR Sharpe Ratio SPY Correlation Max Drawdown
35 Backtest 18.00% 0.73 0.14 -31.40%
Total Periods SPY 6.10% 0.24 -55.20%
107
Total Days
2236