
Owens-Illinois, Inc. (NYSE:OI) reported first-quarter 2019 adjusted earnings of 51 cents per share which missed the Zacks Consensus Estimate of 53 cents. The bottom line also declined 14% from the prior-year quarter figure of 59 cents.
Operational Update
Net sales declined 6% year over year to $1,638 million, as favorable pricing was offset by decline in shipments and unfavorable currency translation. The top line lagged the Zacks Consensus Estimate of $1,637 million.
Cost of sales declined 5% year over year to $1,340 million. Gross profit declined 7% year over year to $298 million. Selling and administrative expenses contracted 9% year over year to $115 million. Segment operating profit dropped 11% year over year to $200 million owing to stronger U.S. dollar, decline in sales volumes, and incremental costs to commission new capacity in order to support growth.
Owens-Illinois, Inc. Price, Consensus and EPS Surprise
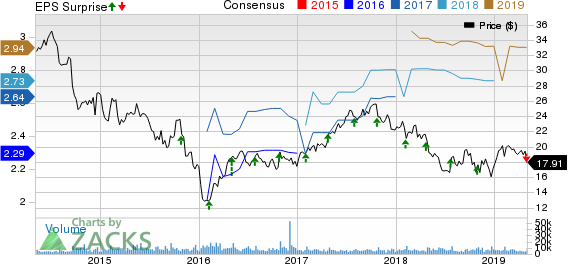
Owens-Illinois, Inc. price-consensus-eps-surprise-chart | Owens-Illinois, Inc. Quote
Segmental Performance
Net sales at the Americas segment declined 3% year over year to $881 million during the first quarter of 2019. Operating profit declined 23% year over year to $113 million.
Net sales at the Europe segment were $596 million, down 7% year over year in the reported quarter. Segment operating profit increased 10% year over year to $79 million.
Net sales in the Asia Pacific region decreased 13% year over year to $151 million in the reported quarter. Operating profit surged 60% to $8 million from $5 million a year ago.
Financial Update
Owens-Illinois had cash and cash equivalents of $326 million at the end of the first quarter of 2019, down from $512 million at the end of 2018. The company utilized $595 million of cash in operating activities during the first quarter of 2019, compared with an outflow of $370 million in the quarter last year. The company’s long-term debt rose to $5.8 billion as of Mar 31, 2019, compared with $5.2 billion as of Dec 31, 2018.
Other Updates
On Apr 1, 2019, Owens-Illinois announced on April 1, 2019 the acquisition of Nueva Fabrica Nacional de Vidrio, S. de R.L. de C.V. from GrupoModelo for approximately $188 million. Subject to customary closing conditions, the acquisition is anticipated to close in the second half of 2019. The company also announced the future expansion at its Gironcourt, France plant.
Outlook
For second quarter 2019, Owens-Illinois guides adjusted earnings per share at 75-80 cents. In the prior-year quarter, the company had reported earnings of 77 cents and 75 cents on a constant currency basis. Higher selling prices are anticipated to fully reflect the annual price increase initiatives by the second quarter which will help mitigate cost inflation. Earnings are likely to benefit from higher sales volumes as new capacity additions support growth in previously constrained markets. It will be further aided by ongoing cost initiatives.
The company maintained adjusted earnings per share guidance at $3.00. Compared with earnings per share of $2.72 reported in 2018, the guidance reflects year-over-year growth of 10%. However, unfavorable foreign currency impact is estimated to be 8 cents per share headwind to earnings in 2019. Nevertheless, volume growth, improved pricing and cost performance augmented by strategic initiatives will drive earnings growth. Cash provided by continuing operations is expected at $740 million and adjusted free cash flow is estimated at around $400 million.
Share Price Performance
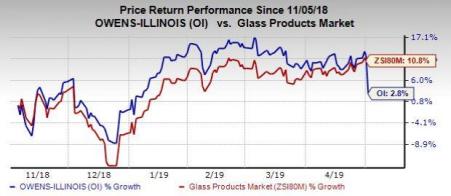
Owens-Illinois’ stock has gained around 2.8% in the past six months, compared with the industry’s growth of 10.8%.
Zacks Rank & Stocks to Consider
Owens-Illinois currently carries a Zacks Rank #4 (Sell).
A few better-ranked stocks in the Industrial Products sector are DMC Global Inc. (NASDAQ:BOOM) , DXP Enterprises, Inc. (NASDAQ:DXPE) and Lawson Products, Inc. (NASDAQ:LAWS) , all sporting a Zacks Rank #1 (Strong Buy), at present. You can see the complete list of today’s Zacks #1 Rank stocks here.
DMC Global has an estimated earnings growth rate of 78.7% for the ongoing year. The company’s shares have soared 72% in the past six months.
DXP Enterprises has a projected earnings growth rate of 22.7% for the current year. The stock has appreciated 4% in the past six months.
Lawson Products has an expected earnings growth rate of 24.5% for the current year. The stock has appreciated 6% in the past six months.
Today's Best Stocks from Zacks
Would you like to see the updated picks from our best market-beating strategies? From 2017 through 2018, while the S&P 500 gained +15.8%, five of our screens returned +38.0%, +61.3%, +61.6%, +68.1%, and +98.3%.
This outperformance has not just been a recent phenomenon. From 2000 – 2018, while the S&P averaged +4.8% per year, our top strategies averaged up to +56.2% per year.
See their latest picks free >>
Owens-Illinois, Inc. (OI): Free Stock Analysis Report
DXP Enterprises, Inc. (DXPE): Free Stock Analysis Report
DMC Global Inc. (BOOM): Free Stock Analysis Report
Lawson Products, Inc. (LAWS): Free Stock Analysis Report
Original post
Zacks Investment Research