
: 33.1%
VIX Status: 16.4
General (Short-term) Trading Call: Hold (aggressive traders can fade off resistance with tight stops, see below)
Active T2108 periods: Day #4 over 20% (overperiod), Day #9 under 40% (underperiod), Day #28 under 70%
Commentary
To regular readers, I again apologize for the disruption in service. You can find the missing archive of T2108 Updates split across two locations, Investing.com and my Seeking Alpha Instablog. The Investing.com articles cover archives that I lost in the server crash because my last back-up was almost a week old (lesson learned!). This was a critical trading period and hopefully you were at least able to follow my alerts on oversold trading conditions on twitter:
This period covers some dramatic movements in T2108 that produced very rare oversold conditions.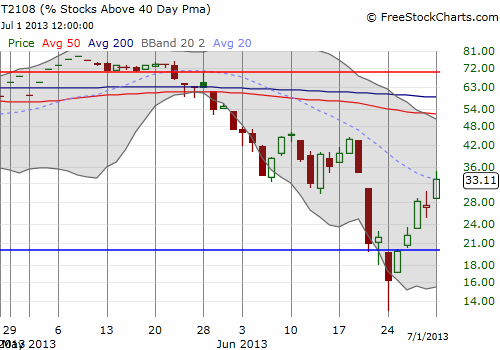
While T2108 closed strong today, the S&P 500 did not. It faded again in near picture-perfect form from resistance which is now a combination of the 50DMA and the 1623 pivot (the old bear/bull dividing line). Yet another case of “you have to see it to believe it.”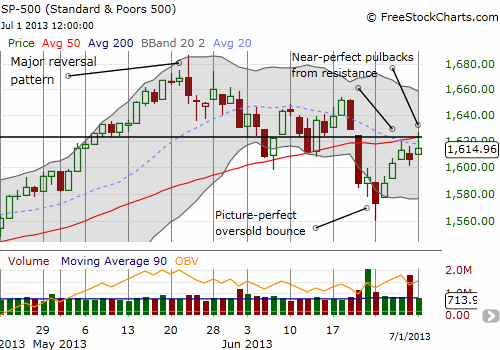
Very aggressive traders can short the S&P 500 here with a very tight stop above today’s high. I choose not to try such a trade because I remain impressed by T2108′s upward momentum. Moreover, I think today’s action produced a bullish divergence between T2108 and the S&P 500. The issue may not get resolved until post-holiday trading. Today’s rally was a classic first-of-the-month rally and produced reflexive buying, especially as part of a recovery from oversold conditions. With the holiday coming up, traders may be content to keep an eye on things but not to make any sudden moves. Expect a lot of churn and fake-outs.
My tweets last week on Apple (AAPL) were particularly fortuitous. The Apple Trading Model (ATM) motivated me to bet on a weak end to the week and a strong beginning to this week. Once again, I moved early on both counts. I bought puts on Wednesday (on schedule) and sold puts into the selling on Thursday; I flipped calls the next day into the rally to $400. I decided not to play Monday’s likely rise, even when the stock pulled back a bit after today’s open. Just one of those moments I hesitated too much (and yet another reminder of why trading rules are so helpful – they free you of having to make ad hoc, on-the-fly, discretionary decisions in a hurried minute!). It was too bad too because Apple was up as much as 3.5% today. I think today confirmed that a lot of the selling that went into quarter-end came from fund managers and the like eager to get Apple off the books ahead of review time. However, I often wonder how true such characterizations can be. How will a manager explain sub-par or otherwise under-performance without being able to blame a few poor positions? Also, don’t the senior managers and/or investors in these funds know about these quarter-end games by now? Maybe they do not care…
Anyway, here is the latest Apple chart. Thankfully, it seems the 52-week low has been successfully retested. When I wrote about Apple sitting between a bottom and a hard $500, I did not really consider this retest part of a likely set of possibilities. It was only after AAPL broke through its 50DMA support in the following week did I suddenly realize the full extent of the downside risks. The high volume buying of the last two days is part of a classic bottoming sign. I suppose this month’s earnings may be the real test and confirmation of this Apple bottom.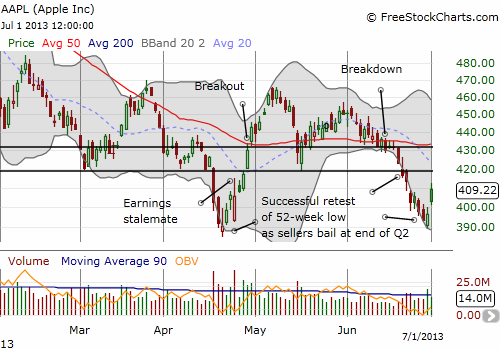

Black line: T2108 (measured on the right); Green line: S&P 500 (for comparative purposes)
Red line: T2108 Overbought (70%); Blue line: T2108 Oversold (20%)
Be careful out there!
Full disclosure: long AAPL
- English (UK)
- English (India)
- English (Canada)
- English (Australia)
- English (South Africa)
- English (Philippines)
- English (Nigeria)
- Deutsch
- Español (España)
- Español (México)
- Français
- Italiano
- Nederlands
- Português (Portugal)
- Polski
- Português (Brasil)
- Русский
- Türkçe
- العربية
- Ελληνικά
- Svenska
- Suomi
- עברית
- 日本語
- 한국어
- 简体中文
- 繁體中文
- Bahasa Indonesia
- Bahasa Melayu
- ไทย
- Tiếng Việt
- हिंदी
Oversold Bounce Hits The Wall Again
Published 07/02/2013, 05:58 AM
Updated 07/09/2023, 06:31 AM
Oversold Bounce Hits The Wall Again
T2108 Status
3rd party Ad. Not an offer or recommendation by Investing.com. See disclosure here or
remove ads
.
Latest comments
Install Our App
Risk Disclosure: Trading in financial instruments and/or cryptocurrencies involves high risks including the risk of losing some, or all, of your investment amount, and may not be suitable for all investors. Prices of cryptocurrencies are extremely volatile and may be affected by external factors such as financial, regulatory or political events. Trading on margin increases the financial risks.
Before deciding to trade in financial instrument or cryptocurrencies you should be fully informed of the risks and costs associated with trading the financial markets, carefully consider your investment objectives, level of experience, and risk appetite, and seek professional advice where needed.
Fusion Media would like to remind you that the data contained in this website is not necessarily real-time nor accurate. The data and prices on the website are not necessarily provided by any market or exchange, but may be provided by market makers, and so prices may not be accurate and may differ from the actual price at any given market, meaning prices are indicative and not appropriate for trading purposes. Fusion Media and any provider of the data contained in this website will not accept liability for any loss or damage as a result of your trading, or your reliance on the information contained within this website.
It is prohibited to use, store, reproduce, display, modify, transmit or distribute the data contained in this website without the explicit prior written permission of Fusion Media and/or the data provider. All intellectual property rights are reserved by the providers and/or the exchange providing the data contained in this website.
Fusion Media may be compensated by the advertisers that appear on the website, based on your interaction with the advertisements or advertisers.
© 2007-2024 - Fusion Media Limited. All Rights Reserved.