Current Position of the Market
S&P 500: Long-term trend – The bull market is continuing with a top expected in the low 3000s.
Intermediate trend – Breaking to a new high has only delayed the anticipated correction into mid-October.
Last week’s action suggests that it may have already started.
Analysis of the short-term trend is done on a daily basis with the help of hourly charts. It is an important adjunct to the analysis of daily and weekly charts which discusses the course of longer market trends.
Market Overview
Since early this month, I have mentioned that we were entering the weakest season of the year -- one which is often characterized by a correction, sometimes severe. Below is a chart of the Dow seasonality.
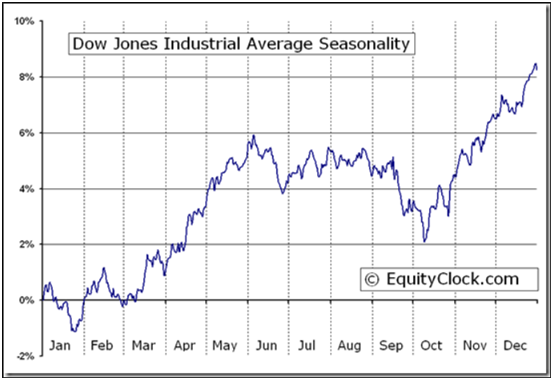
The graph is an average of many years, and it is likely that each year will vary from this chart to some degree. In fact, this year the market chose to make an all-time high a week ago Friday before starting what could be one of its deepest corrections since the January retracement concluded. As you will see, SPX closed on an important trend line, and it could easily break through it next week.
Besides seasonality, one of the reasons I felt we were on the edge of a correction was because of the recent action of IWM which tends to be a reliable early bird for important market corrections. It peaked at an all-time high of 173 on 8/31,and has been caught in a mild decline ever since, appearing to be waiting for the Dow and SPX to join it in a downtrend. On Friday, it closed at a four-week low.
Chart analysis (The charts that are shown below are courtesy of QCharts)
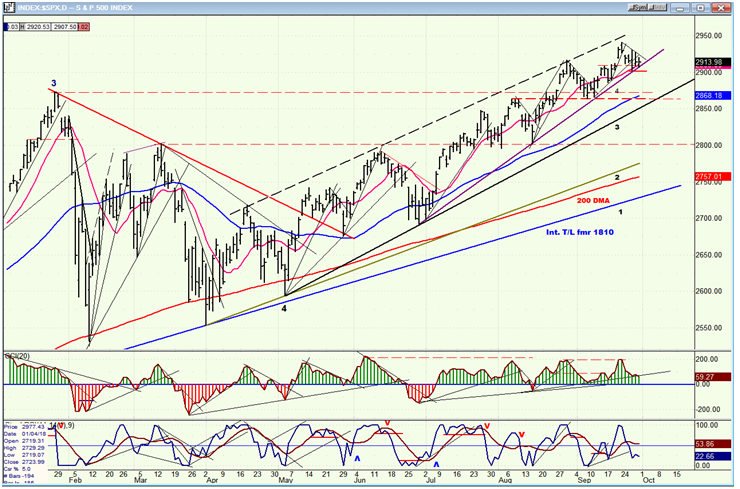
SPX daily chart
The trend line which is being challenged starts at 2692. It is important to note that it has not yet been broken; and Friday SPX refused to close outside of it and below Wednesday’s low of 2903, which is what would have been needed to give a reliable sell signal. This could come as early as Monday, or be delayed until later in the week. A weak opening on Monday could get a decline started which could last until the middle of October, which is the ideal low for the next 20-wk cycle.
A decline to about 2860 would take us to the next important trend line which should offer good support.This would also be a retracement to the area of the January high which already provided support for the last short-term correction. In addition, this is where the declining price would meet the rising 50-DMA. It is highly unlikely thateven these combined factors will not stop the decline which is already under way from 2941 (at least temporarily),whether it starts from Friday’s close orfrom a little higher. Friday’s action formed a congestion ledge which could give us a final bounce to about 2930 before we roll over, but not if Monday begins with a drop below 2903.
I have removed the A/D oscillator in order to provide more room for the price chart, but I can tell you that, on Friday, it closed substantially in the negative, and you can see that SRSI did as well. However, CCI is still positive, which spells caution about calling for a sell signal as of Friday. One will be confirmed when the trend line has been broken and that indicator has gone negative.
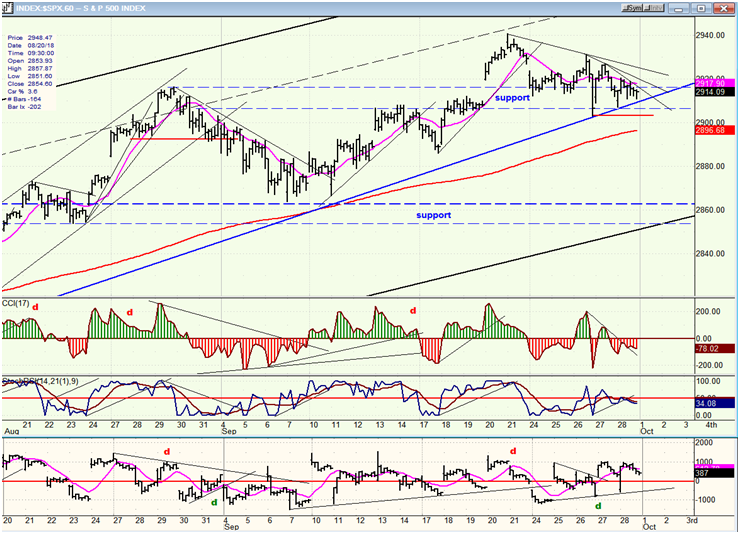
SPX hourly chart
The hourly chart will also show that Friday’s close left us without compelling proof that a sell signal has been given. The trend line in question is represented here in blue. It was tested both on Wednesday at the close, and on Friday at the opening. Both times it held and generated a rebound with Friday’s being weaker than Wednesday’s, butthe index held above it all day, showing that traders were not ready to slice through it and putting off that decision until Monday, at the earliest.
The pattern made on the bar chart since Wednesday is a triangle, and since a triangle is purported to be a continuation pattern, one would have to assume that the decline will resume on Monday. However, a congestion pattern 15 points across was created in the last three hours of trading and, if we open up on Monday and surpass 2821, we could extend the move to above 2930. That might create enough momentum to push even higher before rolling over. The analysis will be easierand more conclusive if we start down right away.
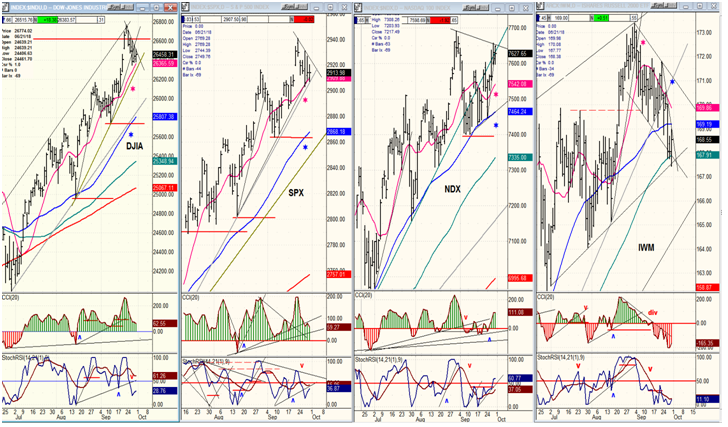
Dow, SPX, NDX,IWM (daily)
Of the four indexes listed below, IWM is clearly the weakest and the one which started its correction earliest, once again justifying its reputation as a market leader. It has already gone below the early June support from which the last rally of the other three developed.
NDX also broke an important trend line on the way to that support and it has, since then, done a series of back-tests of that trend line. It should be ready to retrace further when they all are.
If we examine the oscillators, the weakest are those of IWM, with NDX next, and the other two being roughly the same. I expect next week to bring a trend line break in Dow and SPX, thereby making it a foursome.
UUP (dollar ETF) weekly
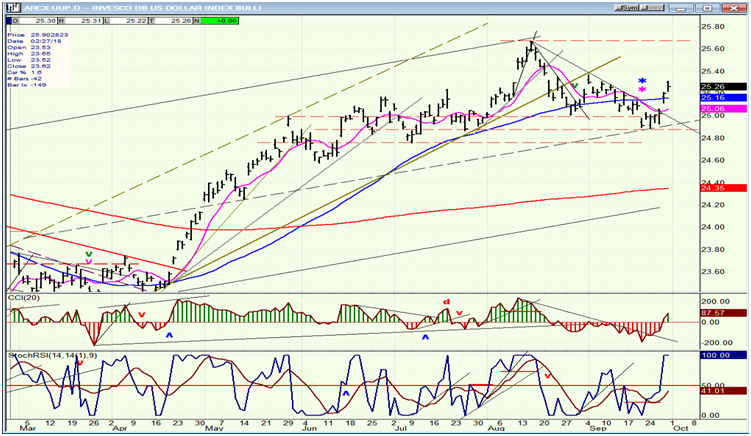
UUP is doing what had been expected of it, which is bouncing back after an initial shallow correction. Hopefully, it will continue and move up to about 25.50 in order to start the distribution pattern which should bring it to a new intermediate term low when complete.
GDX (Gold miners ETF) weekly
GDX is behaving pretty much as expected and appears to be working on the base necessary to extend its recovery from the low. There is a possibility that it may be forming that base in the form of an inverted H&S pattern. I will wait for a little more confirmation before I label it as such. In any case, it may continue its correction all the way down to the parallel dashed line before reversing.
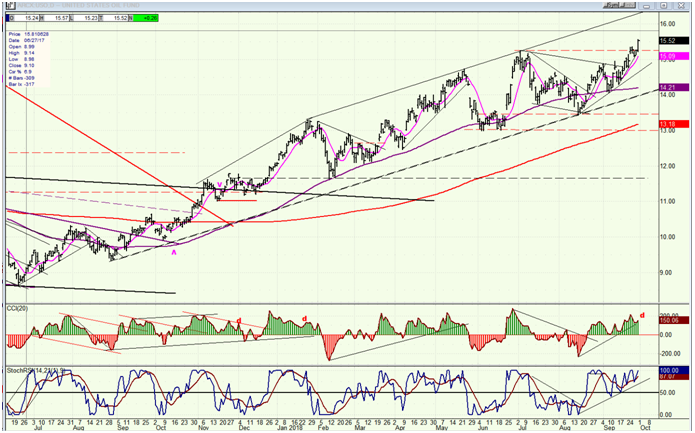
USO is proving to be one of the easiest stocks to analyze. It conforms to trend lines, parallels,and P&F projections almost to perfection. The index completed a minor consolidation and has already made a new high. Its current target is 17:00-17:50, but this may only be a short-term projection. After a longer correction, it could extend its rally to about 25.00. This will have to be confirmed by future action.
Summary
SPX may havealready started a correction into the next 20-week cycle low which is due about mid-October. To confirm, it will have to break the daily trend line which is discussed above.
