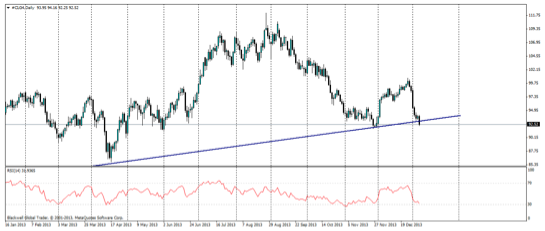
Over the last 24 hours, the oil market took a dramatic turn. After playing on technicals in the month of December and bouncing off its long term trendline strongly, oil looked to be in the resurgence mode as it picked up from the bounce strongly with two massive candles. But as many can see, it looks like that run may have come to an end.
The reason for the end of this run is led by a strong USD and also the developments currently happening in the North American region.
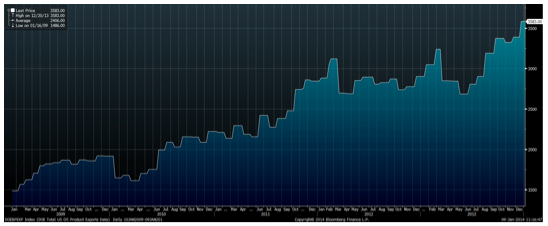
Firstly, the fracking development has been aggressive in the US, leading to many untouchable reserves to be quickly opened up and thus leading to a massive increase in supply for the USA, though not without its environmental controversy. The increase in oil production is so much that it has pushed US crude production to a quarter century high, as oil production increased 18% for 2013. All in all, the USA is expected to become the worlds largest producer by 2015 – 5 years sooner than originally predicted the year before.
Source: Bloomberg – DoE US Oil exports
As can be seen from the graph above, certainly the growth in oil exports has been rapid, and this is expected to increase further as more projects come out of the pipeline and into production mode. The future of fracking in the US certainly looks bright, given the drive from internal oil companies keen to take advantage of the reserves.
Secondly, in recent weeks the Mexican government has removed a barrier for firms to invest in state oil production. This is expected to bring about 15 billion US dollars of spending on infrastructure that will increase oil production and bring about another 2.5 million barrels a day online – a massive increase for Mexico. However, these changes may take time given the inherent blocks that may not have been realised yet in Mexico from certain government officials on the problem with corruption. Either way you look at it though, Mexico is set for a boom for its oil production, and it is likely the oil companies won’t look to drag their heels.
Overall, these global events paint a picture on the fundamental side of things, but the breakthrough on the charts today as we have seen, is a major technical move as well. The drop below the bullish trend line shows the power of an increase in supply in the near future, and the eventual turnaround of the US dollar. The RSI is also showing that many traders have now switched to short positions, a candle tomorrow showing further selling strength would certainly equal the end of the bull run.
It’s rare that the fundamentals and technical come together so well, but in this case it’s a great opportunity for oil traders. A recent survey from Bloomberg revealed that many believe that in 2017, oil will be $88.00 a barrel, this certainly says a lot for the future outlook after all. But for me, my focus will be on watching recent oil movements and if it is indeed trending lower based on the overwhelming fundamental data.
Written by Alex Gurr, a Currency Analyst with Blackwell Global.
- English (UK)
- English (India)
- English (Canada)
- English (Australia)
- English (South Africa)
- English (Philippines)
- English (Nigeria)
- Deutsch
- Español (España)
- Español (México)
- Français
- Italiano
- Nederlands
- Português (Portugal)
- Polski
- Português (Brasil)
- Русский
- Türkçe
- العربية
- Ελληνικά
- Svenska
- Suomi
- עברית
- 日本語
- 한국어
- 简体中文
- 繁體中文
- Bahasa Indonesia
- Bahasa Melayu
- ไทย
- Tiếng Việt
- हिंदी
Oil: Breaks Through Key Trend Line
Published 01/10/2014, 02:41 AM
Updated 05/14/2017, 06:45 AM
Oil: Breaks Through Key Trend Line
3rd party Ad. Not an offer or recommendation by Investing.com. See disclosure here or
remove ads
.
Latest comments
Install Our App
Risk Disclosure: Trading in financial instruments and/or cryptocurrencies involves high risks including the risk of losing some, or all, of your investment amount, and may not be suitable for all investors. Prices of cryptocurrencies are extremely volatile and may be affected by external factors such as financial, regulatory or political events. Trading on margin increases the financial risks.
Before deciding to trade in financial instrument or cryptocurrencies you should be fully informed of the risks and costs associated with trading the financial markets, carefully consider your investment objectives, level of experience, and risk appetite, and seek professional advice where needed.
Fusion Media would like to remind you that the data contained in this website is not necessarily real-time nor accurate. The data and prices on the website are not necessarily provided by any market or exchange, but may be provided by market makers, and so prices may not be accurate and may differ from the actual price at any given market, meaning prices are indicative and not appropriate for trading purposes. Fusion Media and any provider of the data contained in this website will not accept liability for any loss or damage as a result of your trading, or your reliance on the information contained within this website.
It is prohibited to use, store, reproduce, display, modify, transmit or distribute the data contained in this website without the explicit prior written permission of Fusion Media and/or the data provider. All intellectual property rights are reserved by the providers and/or the exchange providing the data contained in this website.
Fusion Media may be compensated by the advertisers that appear on the website, based on your interaction with the advertisements or advertisers.
© 2007-2024 - Fusion Media Limited. All Rights Reserved.
