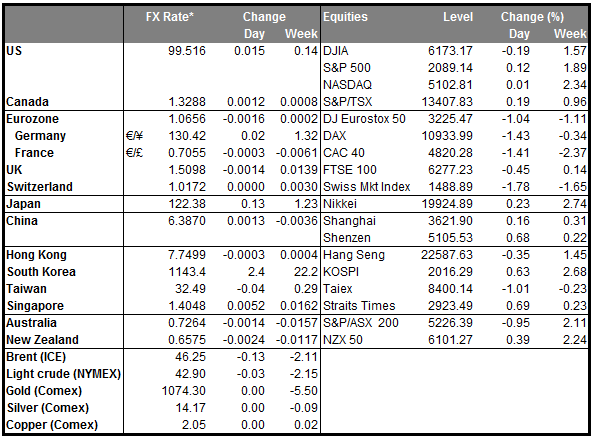
• Oil deal depends on Iran’s cooperation The oil ministers of Iraq, Iran and Venezuela will meet in Tehran today to discuss a potential oil output freeze. The meeting follows an agreement between four oil producers yesterday, including Saudi Arabia and Russia, to maintain production at current levels but with the condition that other major producers will follow suit. Iraq, OPEC’s second largest producer, appears willing to cooperate in an agreement to tackle oversupply. However, investors see a potential cooperation by Iran to be unlikely, given the country’s determination to raise output and recover its lost market share. There is a distinct possibility though that Iran is offered special terms as part of this deal. These special terms could range from allowing the nation to boost exports to pre-sanction levels and then freeze output, to permitting Iran to gradually increase production when oil prices begin to rise again. A potential agreement could cause oil prices to stabilize, at least temporarily, while no agreement could add more fuel in the oil downtrend as the prospect of supply-side stabilization will become less likely.
• Fed’s Rosengren reaffirms a slower rate path Boston Fed President Eric Rosengren said overnight that if the global weakness were to be transmitted to the US, there would be little need to raise rates until the economy was growing close to its potential rate. He added that if inflation is slower to return to the target, policy normalization should be more gradual. By expressing these concerns, Rosengren joined other voting FOMC members that have recently voiced their reluctance to raise rates further before any impact of the global turmoil on the US economy becomes clear. Market expectations for a rate hike in March are already very close to zero. If we were to see more voting members adopting a similar outlook, this could bring down expectations for more hikes during this year.
• As for today’s events, during the European day, we get the UK employment report for December. The unemployment rate is expected to have declined to 5.0% from 5.1%, which would mark the 6th consecutive fall and point to further tightening in the UK labor market. Nevertheless, investors’ eyes will most probably be on average weekly earnings which are forecast to have slowed to 1.9% yoy from 2.0% yoy. BoE’s Ian McCafferty said on Monday that he withdrew his call for a hike at the latest meeting because inflationary pressures in the UK have receded. He also added that the recent fallback in wage growth suggests that there is no longer an urgent need for a hike. Given these comments by a member who has been the lone voice for a rate increase from August until January, further slowdown in wages could push further back expectations for a rate increase and could cause the pound to extend yesterday’s declines. In any case, any reaction from the sterling on the data could be short lived as the main focus remains on Friday’s Brexit talks.
• In the US, the Fed releases the minutes of its January 26-27 meeting. At this meeting, the FOMC remained on hold as was widely expected and in the statement accompanying the decision the Committee noted that it is monitoring international developments and how those could impact the US economy. Since the meeting, the uncertainty surrounding financial markets has increased and concerned comments from several Fed members, including Chair Yellen, have eliminated any market expectations for a March hike. On the other hand, Cleveland Fed President Loretta Mester adopted a different stance, saying that the economy remains sound and will overcome market turbulence, allowing the Fed to continue tightening. While the minutes will likely not give us any clear hints on when the Fed is thinking to hike rates again, they may reveal more insights on the different views within the FOMC.
• As for the US indicators, industrial production for January is forecast to have risen after falling for three consecutive months. Bearing in mind that the ISM manufacturing PMI for the same month remained below 50, we see a high likelihood that the IP figure may not rise by as much as expected. US housing starts are forecast to have increased somewhat in January, while the more forward-looking building permits for the same month are expected to have declined marginally. This data show that the US housing sector remains healthy and could support the dollar at the release. The US PPI data for January are coming out as well.
The Market
EUR/USD rebounds from near 1.1125
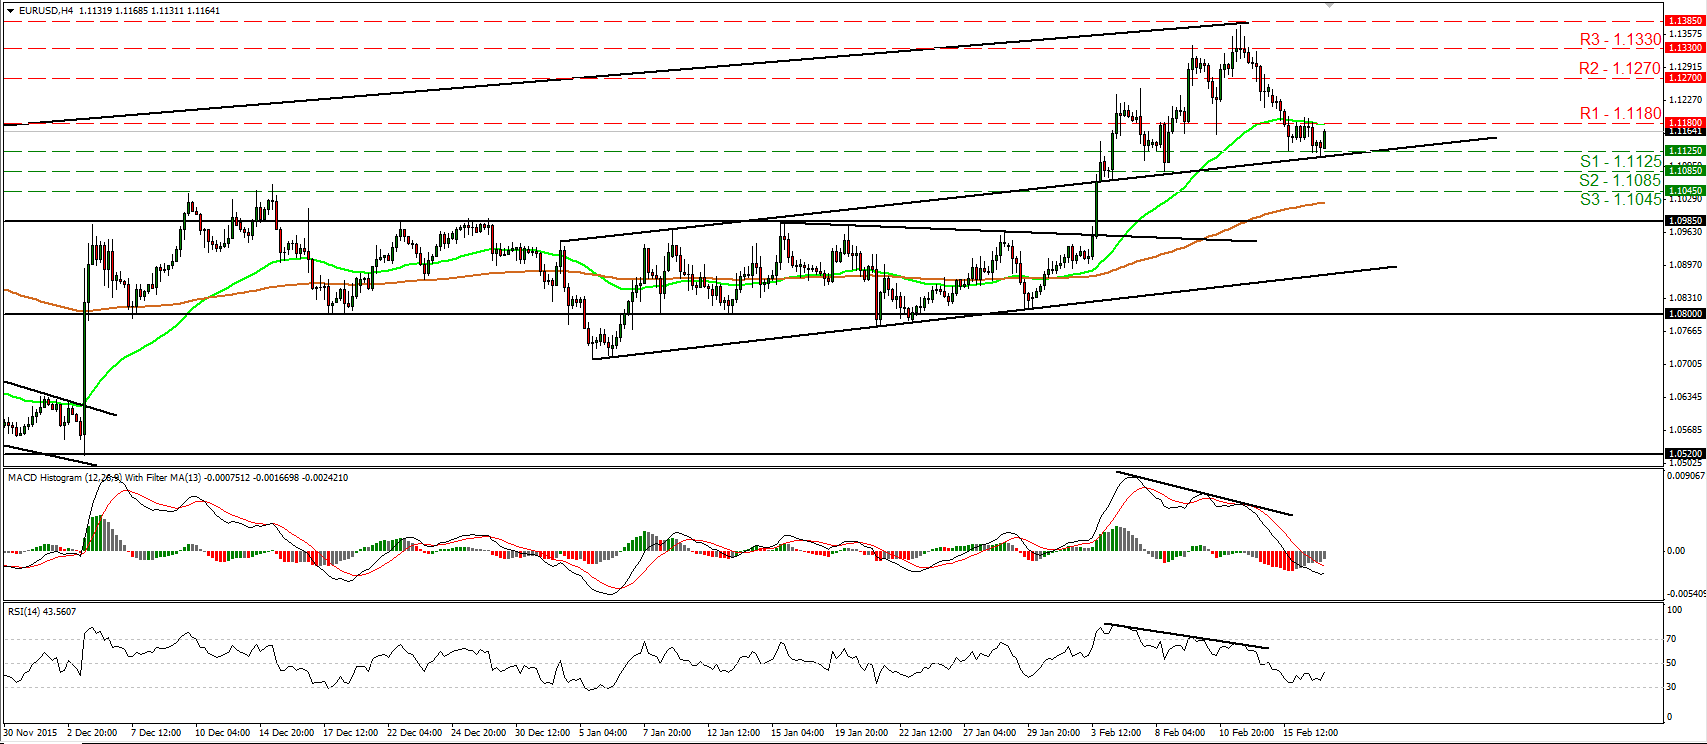
• EUR/USD traded slightly lower yesterday, moved briefly below the 1.1125 (S1) support line, but today during the Asian morning it rebounded and is now headed towards the 1.1180 (R1) resistance territory. Given that on the 3rd of February the pair emerged above the 1.0985 hurdle, which is the upper bound of the sideways range it had been trading since December, I still see the likelihood for the pair to turn up again at some point. A clear break above 1.1180 (R1) is likely to confirm the case and could open the way for our next resistance zone of 1.1270 (R2). Our short-term oscillators corroborate my view. The RSI has turned up again and looks to be headed towards its 50 line, while the MACD, although negative, shows signs of bottoming and could move above its trigger line soon. Switching to the daily chart, I see that the rate started sliding after it hit the prior upside support line taken from the low of the 13th of March 2015. The retreat was stopped by the prior upside resistance line taken from the peak of the 4th of January. This increases the possibilities for the pair to bounce higher for a while. As for the broader trend, as long as EUR/USD is trading between the 1.0800 key zone and the psychological area of 1.1500, I would keep the view that the broader trend remains sideways.
• Support: 1.1125 (S1), 1.1085 (S2), 1.1045 (S3)
• Resistance: 1.1180 (R1), 1.1270 (R2), 1.1330 (R3)
USD/JPY hits resistance fractionally below 115.00
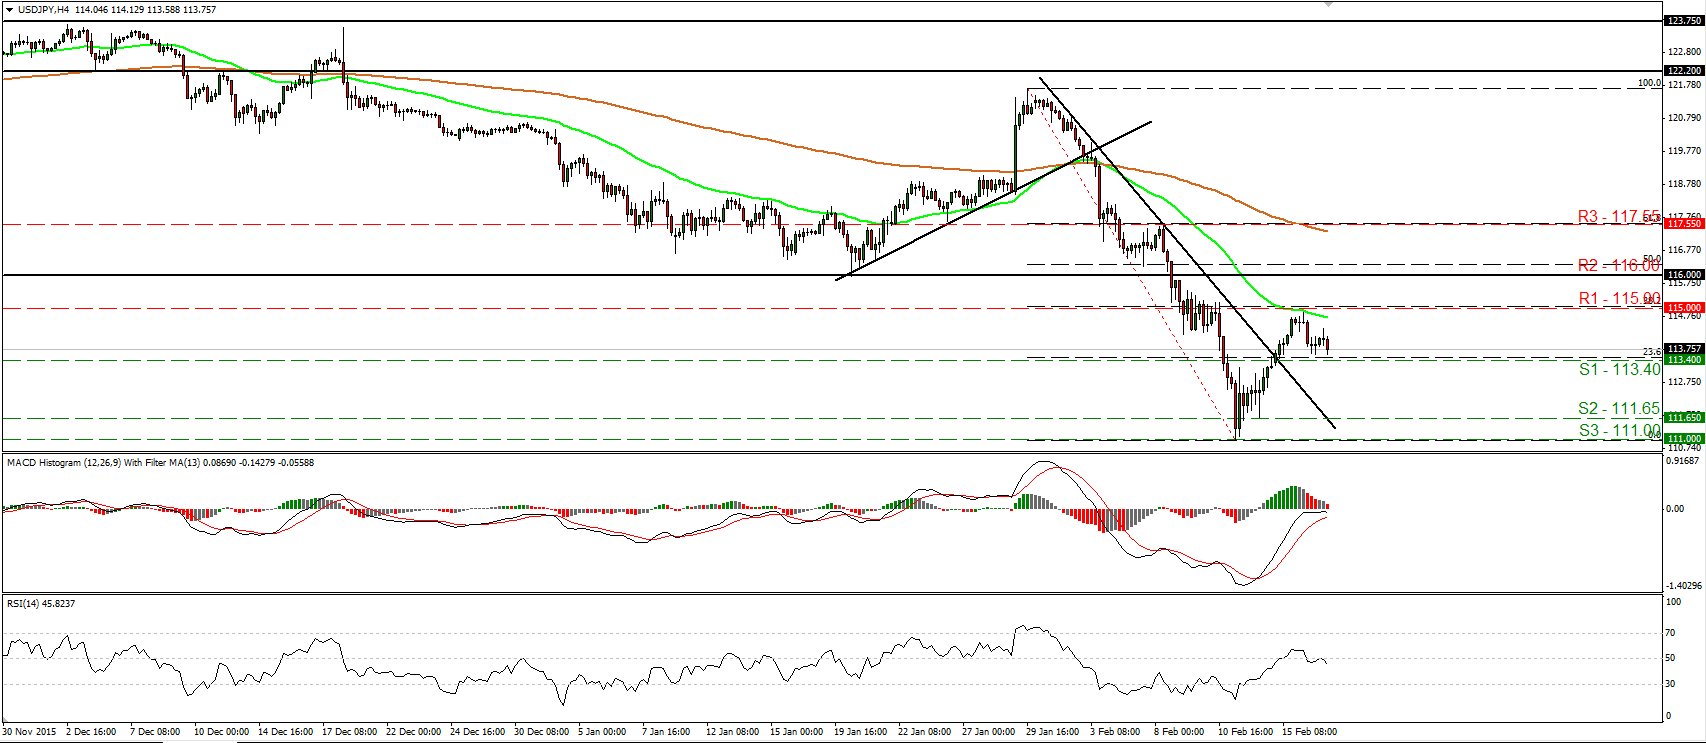
• USD/JPY traded lower on Tuesday after it hit resistance fractionally below the 115.00 (R1) resistance zone, which happens to be the 38.2% retracement level of the 29th of January – 11th of February decline. In my opinion, a clear dip below 113.40 (S1) is likely to confirm that the recovery from the 11th of February was just a correction, and could open the way for the next support zone of 111.65 (S2). Looking at our short-term oscillators, I see that the RSI has turned down and fell below its 50 line, while the MACD shows signs of topping slightly below its zero line. These indicators detect somewhat negative momentum and magnify the likelihood for the pair to slide lower. As for the bigger picture, I still believe that the close below 116.00 (R2) has turned the longer-term outlook negative. This is another reason I would see the recovery from 111.00 (S3), or any extensions that stay limited below 116.00 (R2), as a corrective phase for now.
• Support: 113.40 (S1), 111.65 (S2), 111.00 (S3)
• Resistance: 115.00 (R1), 116.00 (R2), 117.55 (R3)
GBP/USD exits a triangle ahead of the UK employment data
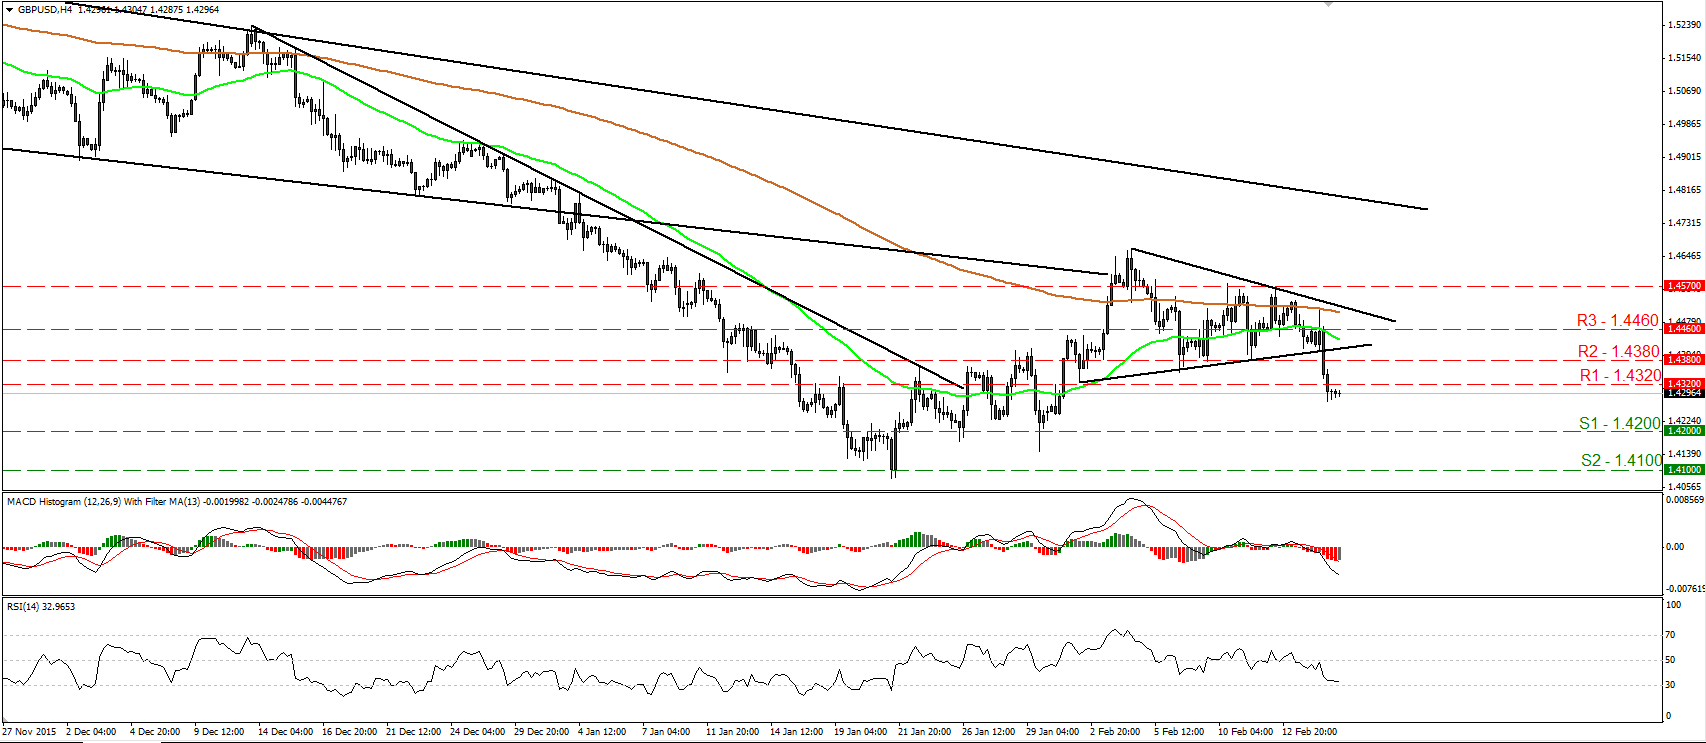
• GBP/USD plunged yesterday, falling below the lower bound of a triangle formation that had been containing the price action since the 2nd of February. This has turned the short-term outlook to the downside and increases the possibilities for further declines. Currently, the rate is trading slightly below the 1.4320 (R1) resistance line and I would expect it to continue lower, perhaps for a test near the 1.4200 (S1) area. The trigger for another negative leg could be a slowdown in the UK wage growth when we get the nation’s employment report later today. Further declines are also supported by our momentum indicators. The RSI continued lower and now appears ready to fall below 30, while the MACD stands below both its zero and trigger lines, pointing south. In the bigger picture, the price structure remains lower peaks and lower troughs below the 80-day exponential moving average, which is pointing down. Thus, I still see a negative longer-term picture and I would treat the 21st of January – 4th of February recovery as a corrective phase for now.
• Support: 1.4200 (S1), 1.4100 (S2), 1.4000 (S3)
• Resistance: 1.4320 (R1), 1.4380 (R2), 1.4460 (R3)
Gold rebounds back above 1200
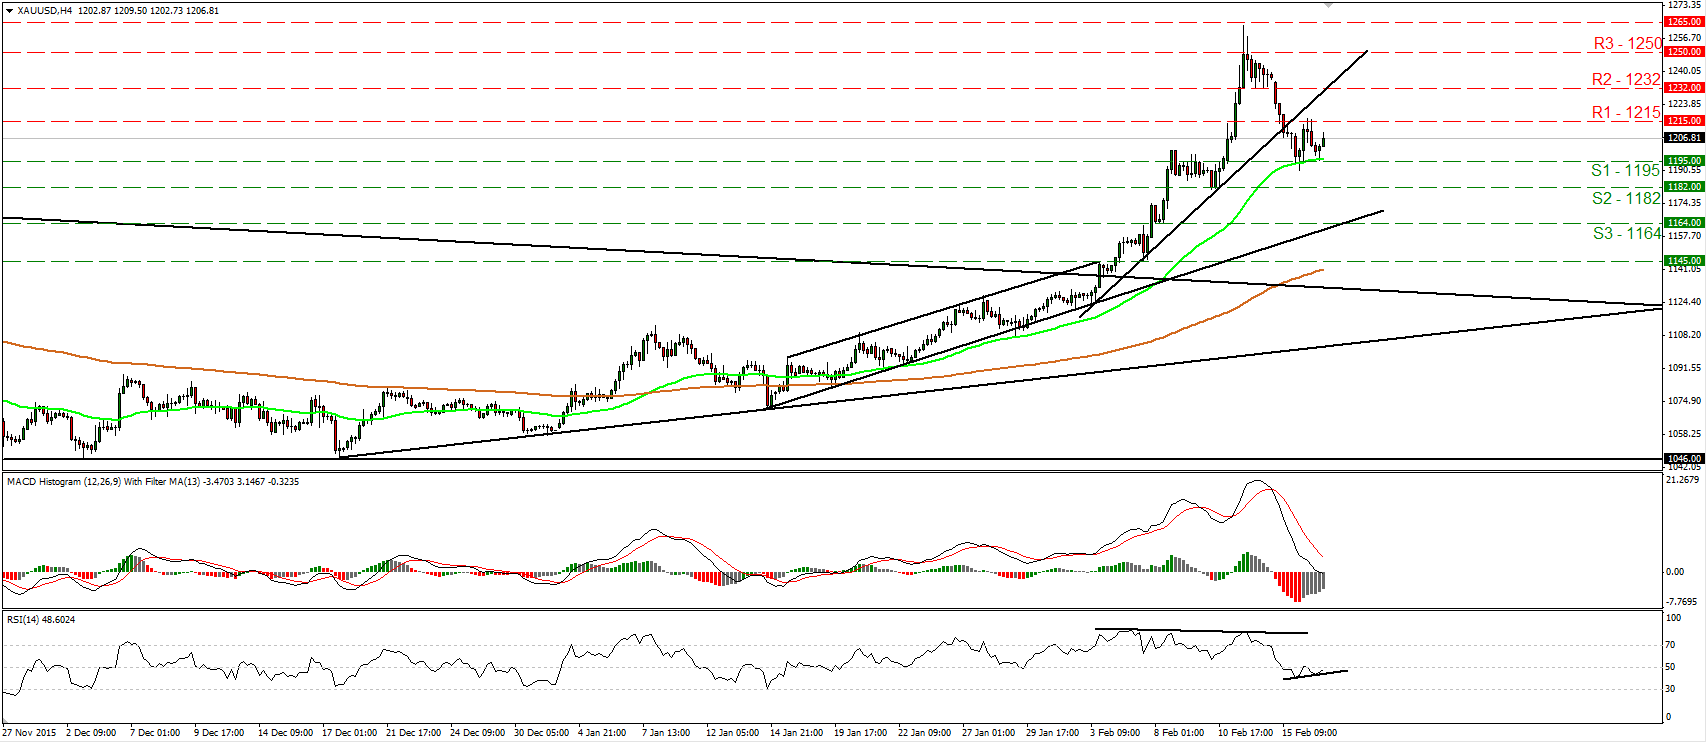
• Gold tried to trade lower yesterday after it fell below 1200, but it hit support at 1195 (S1) and then it rebounded. Although the metal is trading below the short-term uptrend line taken from the low of the 3rd of February, I see the likelihood for the yellow metal to bounce higher for now. A clear move above 1215 (R1) would reaffirm the case and is possible to aim for the 1232 (R2) resistance zone. This case is also supported by our momentum indicators. The RSI turned up and looks able to move above its 50 line, while the MACD stands fractionally below zero, but shows signs of bottoming. Switching to the daily chart, I see that on the 4th of February, the price broke above the long-term downside resistance line taken from the peak of the 22nd of January 2015. As a result, I would consider the medium-term outlook to be cautiously positive and I would treat the setback from 1265 as a corrective phase for now.
• Support: 1195 (S1), 1182 (S2), 1164 (S3)
• Resistance: 1215 (R1), 1232 (R2), 1250 (R3)
WTI slides back below 30.00
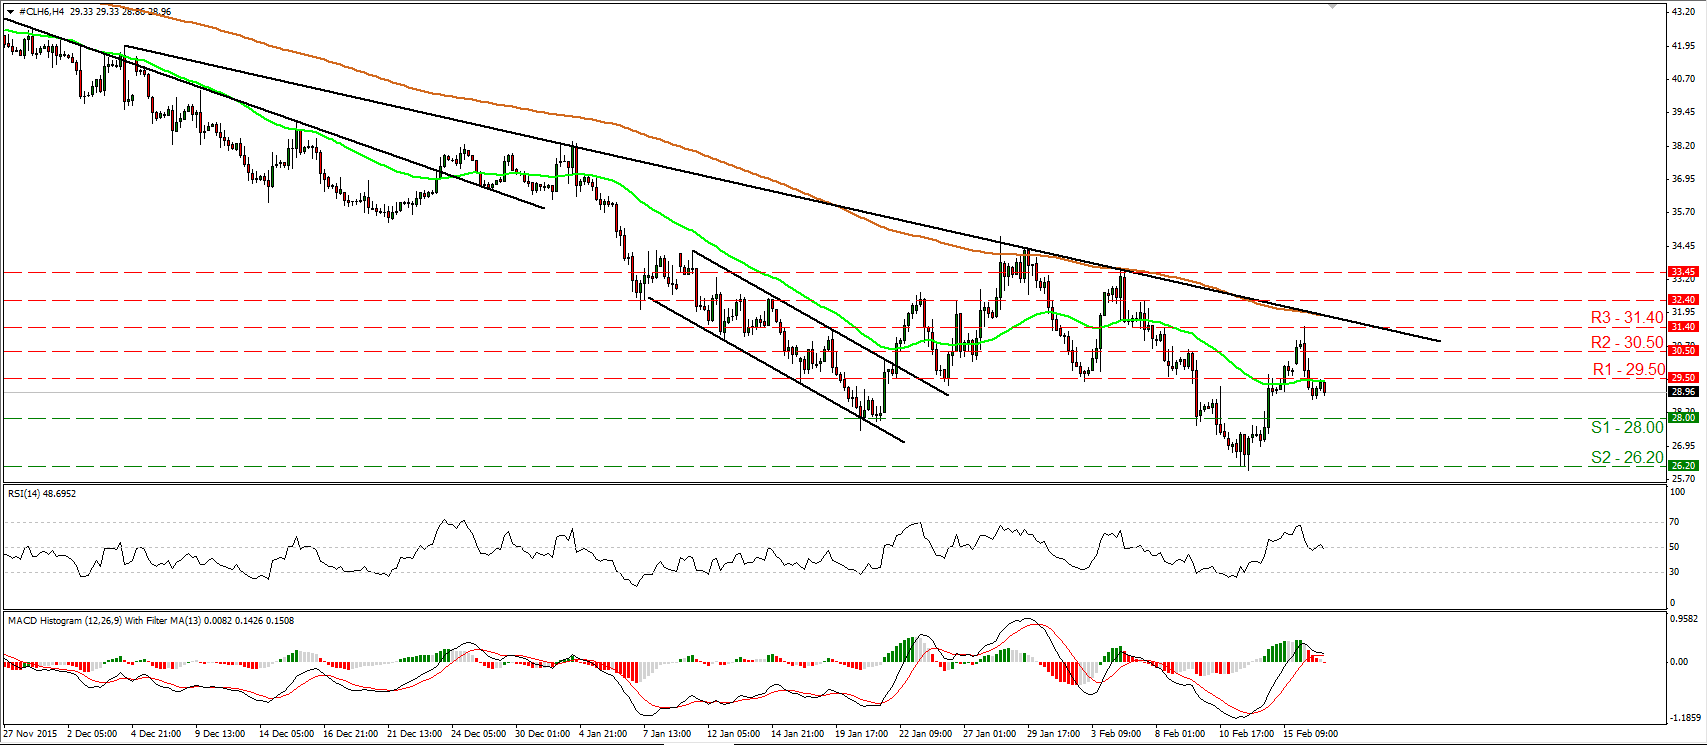
• WTI slid yesterday after it hit resistance at 31.40 (R3). The price fell back below the 30.00 mark and is currently trading slightly below the 29.50 (R1) barrier. Given that the price is still trading below the downtrend line taken from the 4th of December, I would consider the outlook to stay negative. I would expect the bears to continue pushing the price lower and perhaps challenge the 28.00 (S1) zone. If they are strong enough to break below 28.00 (S1), I would expect them to aim for the 26.20 (S2) support, marked by the low of the 11th of February. Our oscillators have turned down corroborating that WTI is possible to extend yesterday’s losses. The RSI has just crossed back below 50, while the MACD, has topped, and could fall below its zero and trigger lines soon. On the daily chart, I see that WTI has been printing lower peaks and lower troughs since the 9th off October. Therefore, I would treat the 11th – 16th of February recovery as a corrective move for now.
• Support: 28.00 (S1), 26.20 (S2), 25.00 (S3)
• Resistance: 29.50 (R1), 30.50 (R2), 31.40 (R3)


