Key Points:
- Price action hinting at some near-term downside risks.
- $50 mark could receive a serious challenge in the coming week.
- US inventories data could spark the forecasted tumble on its release.
Oil prices could have a rather torrid start to 2017 as, despite its long-term bullish bias, the commodity might have some large corrective moves in the wings during its ultimate ascent. Importantly, this will mean that the market could be about to flex its muscles and test just how effective the production freeze instigated by OPEC is in propping up that $50 support.
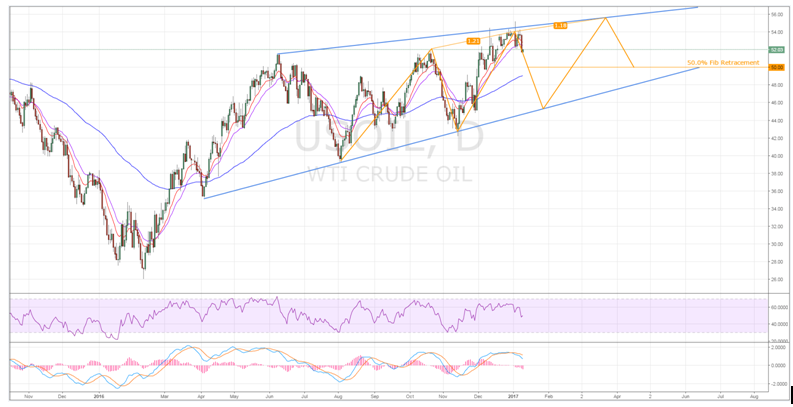
If we take a closer look at Oil’s technical bias it becomes fairly apparent that its price action is beginning to form a rising wedge structure. However, as the commodity has retraced within the confines of the wedge, it has been tracing a rather faithful three-drive or ABC pattern which should mean that a near-term slip is now on the cards. Indeed, some heavy selling pressure is already mounting as was seen during the prior session which resulted in around a 3.5% decline in Oil prices.

In addition to the price action described above, there are a handful of other technical signals that are hinting that Oil could mount a serious challenge to the $50 support. Firstly, the MACD oscillator has recently had a signal line crossover which would suggest a near-term top has formed. In addition to this, whilst not shown, the Parabolic SAR bias has shifted to bearish which should help the downtrend to remain firmly in place.
However, there are also some dissenting technical readings which could help the bulls to defend the $50 mark quite effectively and, therefore, keep Oil in a ranging phase in the near-term. Primarily, the 100 day moving average should prove to be a source of some dynamic support which could certainly dampen any attempt to send the commodity plunging lower. Additionally, this price coincides with the 50.0% Fibonacci retracement which will also be limiting downside risks somewhat.
Setting aside technicals however, the imminent announcement of the US Crude Oil Inventories could provide all the momentum needed to spark the forecasted downtrend. Currently expected to post a build of 1.19M, the result would reinforce the negative effects of the recent rig count data. Specifically, Baker Hughes’ December numbers showed a month-on-month uptick of 94 rigs internationally, 90 of which were North American.
Ultimately, it’s unlikely that the long-term uptrend disintegrates just yet, as that would probably require the OPEC agreement to fall apart. However, the downside potential available as Oil makes its journey higher is quite considerable and shouldn’t be discounted just because the $50 mark has been forecasted to hold firm in the wake of the production freeze.
