
NZD/CAD traded higher on Tuesday, after it hit support at 0.8510 on Monday. At the time of writing, the bulls are trying to overcome the 0.8575 barrier, which is Friday’s high, but also the upper end of the sideways range that contained most of the price action from April 8th until today. So, having that in mind, we will adopt a cautiously-bullish approach for now.
If the bulls are strong enough to close the current 4-hour candle above the upper end of the pre-discussed range, then we may see them climbing towards the 0.8635 level, which is marked as a resistance by an intraday swing high formed on March 12th. They may decide to take a break after testing that zone, thereby allowing a correction lower. However, as long as such a retreat stays above the upper bound of the range, we would see decent chances for another leg north. This time, the 0.8575 territory may get broken, which is likely to set the stage for advances towards the 0.8700 area, near the high of March 11th.
Looking at our short-term oscillators, we see that the RSI edged up and now appears ready to challenge its 70 line, while the MACD, already positive, has just poked its nose above its trigger line. Both indicators detect accelerating upside speed and support the notion for further advances in the near term.
In order to abandon the bullish case, we would like to see a decent dip back below 0.8510, which is yesterday’s low. Such a move may signal that traders want to keep this pair trendless for a while more and may initially target the inside swing high of May 19th, at 0.8484. Another break, below that zone could extend the slide towards 0.8450, the break of which may set the stage for the low of that day, at 0.8412, or the lower boundary of the aforementioned range, at 0.8390.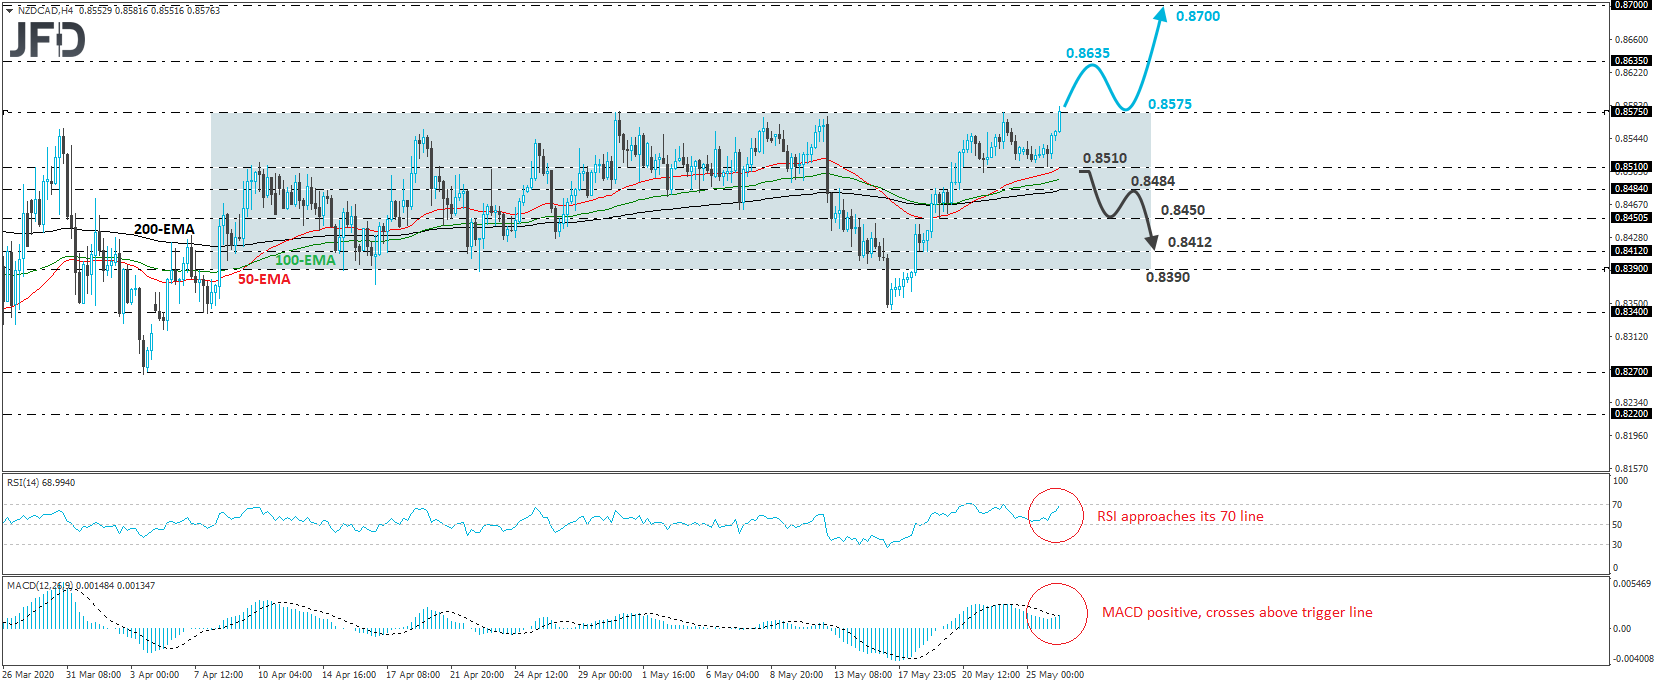
- English (UK)
- English (India)
- English (Canada)
- English (Australia)
- English (South Africa)
- English (Philippines)
- English (Nigeria)
- Deutsch
- Español (España)
- Español (México)
- Français
- Italiano
- Nederlands
- Português (Portugal)
- Polski
- Português (Brasil)
- Русский
- Türkçe
- العربية
- Ελληνικά
- Svenska
- Suomi
- עברית
- 日本語
- 한국어
- 简体中文
- 繁體中文
- Bahasa Indonesia
- Bahasa Melayu
- ไทย
- Tiếng Việt
- हिंदी
NZD/CAD Tries To Break Upper End Of A Range
Published 05/26/2020, 06:50 AM
Updated 07/09/2023, 06:31 AM
NZD/CAD Tries To Break Upper End Of A Range
3rd party Ad. Not an offer or recommendation by Investing.com. See disclosure here or
remove ads
.
Latest comments
Install Our App
Risk Disclosure: Trading in financial instruments and/or cryptocurrencies involves high risks including the risk of losing some, or all, of your investment amount, and may not be suitable for all investors. Prices of cryptocurrencies are extremely volatile and may be affected by external factors such as financial, regulatory or political events. Trading on margin increases the financial risks.
Before deciding to trade in financial instrument or cryptocurrencies you should be fully informed of the risks and costs associated with trading the financial markets, carefully consider your investment objectives, level of experience, and risk appetite, and seek professional advice where needed.
Fusion Media would like to remind you that the data contained in this website is not necessarily real-time nor accurate. The data and prices on the website are not necessarily provided by any market or exchange, but may be provided by market makers, and so prices may not be accurate and may differ from the actual price at any given market, meaning prices are indicative and not appropriate for trading purposes. Fusion Media and any provider of the data contained in this website will not accept liability for any loss or damage as a result of your trading, or your reliance on the information contained within this website.
It is prohibited to use, store, reproduce, display, modify, transmit or distribute the data contained in this website without the explicit prior written permission of Fusion Media and/or the data provider. All intellectual property rights are reserved by the providers and/or the exchange providing the data contained in this website.
Fusion Media may be compensated by the advertisers that appear on the website, based on your interaction with the advertisements or advertisers.
© 2007-2024 - Fusion Media Limited. All Rights Reserved.