
The Kiwi Dollar climbed higher following a stronger than expected Chinese Trade Balance which was released around 10.05 am SGT (9.05 pm EDT). Even though China is the 2nd on the list of New Zealand exports destinations, it still remains extremely important as it contributes close to 19% of total exports. Furthermore, China is the number one destination for Australian exports, which incidentally is New Zealand's largest trading partner. As such, an improvement in Chinese economy will improve Australia's and New Zealand's directly and indirectly.
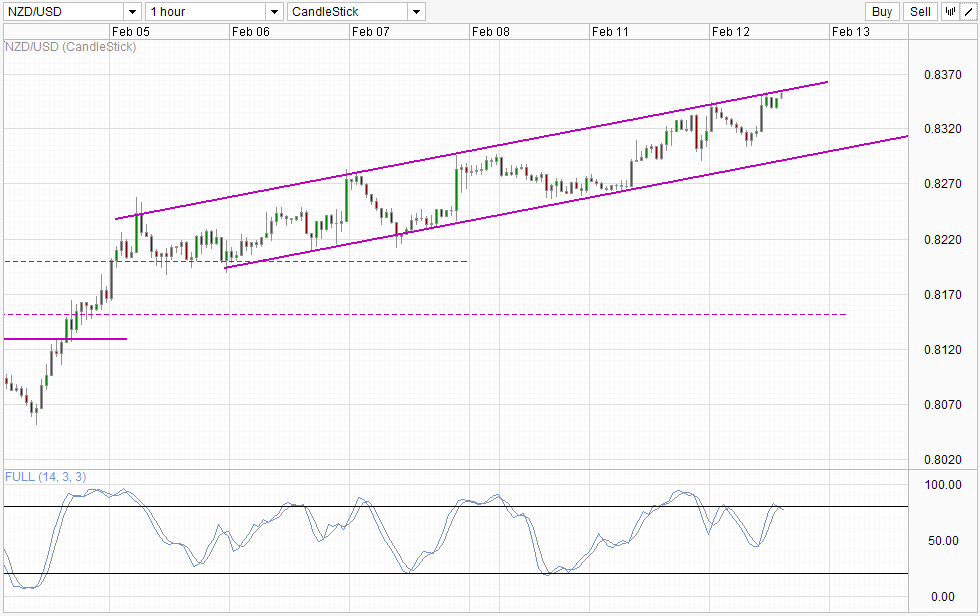
Hourly Chart
 NZD/USD Hourly" title="NZD/USD Hourly" height="242" width="474">
The rally in NZD/USD was also rather timely, as prices were paring gains made overnight during the US session when risk appetite was broadly bullish after Yellen made her first maiden monetary policy address in the capacity of Fed Chairman. This early decline is not surprising as what Yellen said does not really inspire confidence about US's recovery nor give hope as she opened her address to the House saying that she's here to continue where Bernanke left off (read: more tapers coming).
Hence, even though NZD/USD did move higher, the risk of a pullback was always there. Furthermore, there is additional technical bearish pressure with Channel Top pressing down and opening a move towards Channel bottom, while Stochastic indicator similarly favor a bearish move with Stoch and signal lines both pointing lower after being capped by Channel Top.
Therefore, the Chinese data helped to negate bearish pressure, but S/T bearish pressure remains as well. Stochastic readings has since moved back up into Overbought region and is now giving us early signs of a bearish signal, while the same Channel Top is still capping gains. As such, do not be surprised if bearishness returns and Channel Bottom will remain a viable target if soft support 0.834 is broken.
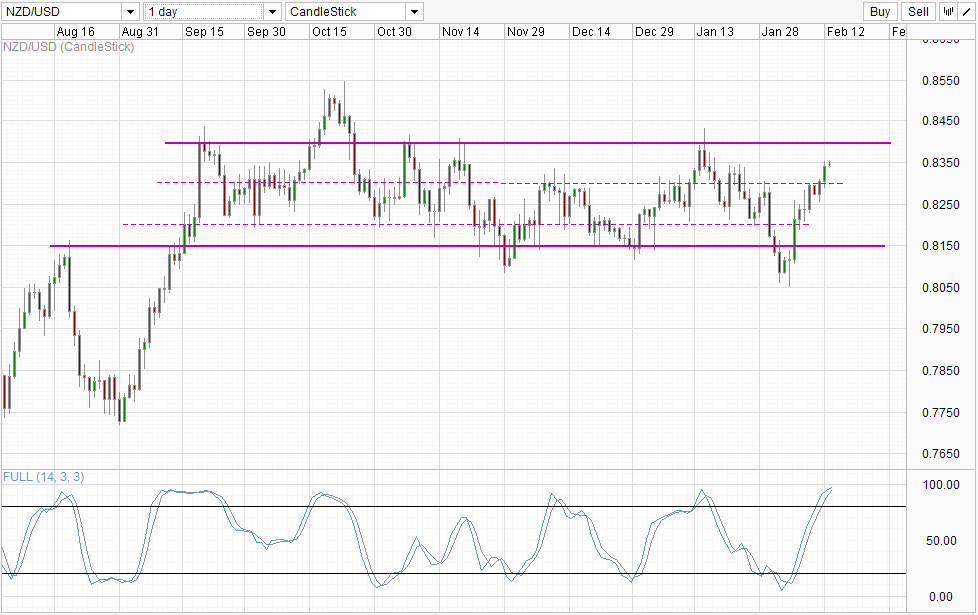
Daily Chart
 NZD/USD Daily" title="NZD/USD Daily" height="242" width="474">
Daily Chart is more bullish though, as the move towards 0.840 continues. However, the ability to break 0.84 remains in doubt as momentum is already Overbought and the pace of bullish gains is undoubtedly slower compared to when prices were around 0.815 - fresh after invalidating bearish breakout attempt. Also, even though NZD is expected to strengthen during the next 1-2 years on RBNZ rate hikes, USD is expected to strengthen as well, hence a sideways trend is more likely to developed as opposed to an outright up or downtrend. Also, recent rallies seems to be aided by a surprising weakening of USD. With US stocks starting to get back into the bullish groove, we could see foreign funds re-entering back into America and that will result in USD strengthening further on top of natural appreciation due to QE tapering. As such, it will not be an easy journey for NZD/USD to climb up further beyond 0.84 unless something fundamentally changes once more (e.g. revision of RBNZ's rate hike target of 2.25%)