
The last three months of 2018 may have been bad for stock market investors in general, but few suffered more than NVIDIA Corporation (NASDAQ:NVDA) shareholders. Nvidia stock climbed to an all-time high of $292.76 a share on October 2nd. By December 24th it was down to $124.50, losing over 57% in less than 90 days.
So it turns out that despite its stellar performance in recent years, Nvidia is still a cyclical company. Due to the very nature of its products, the company simply cannot sustain good business results for very long. Combine this with people’s uncontrollable greed during times of prosperity and you get the perfect setup for a spectacular crash when the tide eventually turns.
The obvious conclusion for stock investors is that they should seek to buy when the price nears a bottom and sell when it is at record highs. Unfortunately, so often they do just the opposite.
Now, with Nvidia stock cut in half, is it time to start buying or stay aside in anticipation of even more weakness? NVDA’s stock price has been out of line with the company’s fundamentals for so long that it would be foolish to rely on them now. Instead, let’s try to decipher the market’s intentions with the help of the Elliott Wave chart below.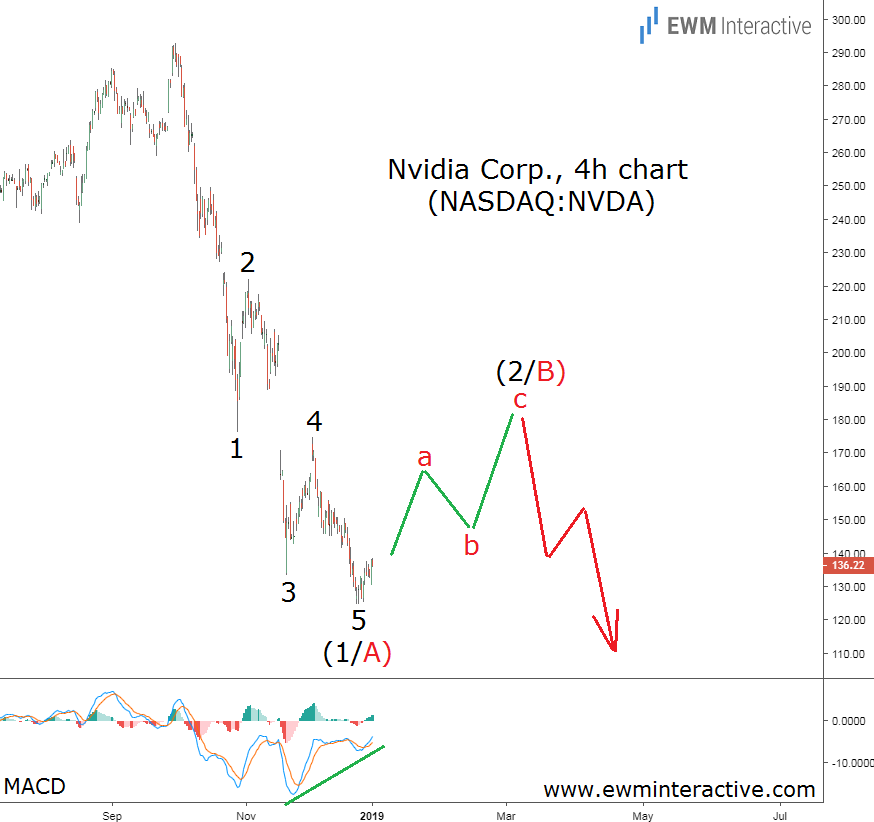
The 4-hour chart of Nvidia stock shows the structure of the entire selloff from the vicinity of $293 to $124.50. As visible, it takes the shape of a textbook five-wave impulse pattern, labeled 1-2-3-4-5 in wave (1/A). One of the Elliott Wave principle’s rules states that within an impulse, wave 3 cannot be the shortest among waves 1, 3 and 5.
Here, wave 3 is definitely shorter than wave 1, but it is longer than wave 5, so there is no violation of the rule. Another rule says that waves 1 and 4 cannot overlap in price. On the chart above, wave 1 ended at $176.01, while wave 4 terminated at $174.68. No violation again.
So what useful information can we extract from this chart? According to the theory, every impulse is followed by a three-wave correction in the opposite direction, before the trend resumes in the direction of the five-wave pattern.
Since Nvidia’s impulsive decline seems complete, this means we can expect a notable recovery in wave (2/B). The resistance area near $180 – $190 looks like a reasonable bullish target. The MACD indicator gives another reason for short-term optimism by revealing a strong bullish divergence between waves 3 and 5 of (1/A).
However, even if the bulls manage to exceed $190, Nvidia stock should be viewed with a grain of salt. We wouldn’t be surprised to see Nvidia stock trading in double digits once wave (3/C) down begins. If this count is correct, the recent 57% crash did not make NVDA cheap enough.