Here we revisit our pricing model for a company from the Utilities category – Northeast Utilities (NU), a public utility holding company, which provides electric and natural gas energy delivery services In April, we concluded that the price should rise in the second quarter of 2012 to the level of $37 per share, with the relevant standard error of $1.23. The closing monthly price (adjusted for splits and dividends) in June was $38.46. It has increased to $39.3 in October. The updated model indicates that the price has to decrease by approximately $2 in the next few months. Otherwise, the price has to be relatively stable over the next seven months, i.e. during the natural forecasting period. One may consider NU as a reliable company for investments but wait before buying at $37.
Before presenting the best fit deterministic pricing model for NU we would like to brief on the underlying pricing concept. Our approach consists in decomposition of a share price into a weighted sum of two consumer (or producer) price indices. One may test quantitatively our simple assumption that the growth in some specific CPI related to NU (e.g. housekeeping supplies, the BLS name is CUUR0000SEHN and we abbreviate it to HOS) relative to some independent but dynamic reference (e.g. food away from home, CUUS0000SEF or SEFV) should be seen in a higher pricing power for the studied company. In essence, our stock price model tries to find one defining CPI and the best reference.
In order to find the best pair of CPIs we calculate the RMS residual errors using all permutations from a set of 92 different (not seasonally adjusted) CPIs. In addition we allow for time lag (fixed between 0 and 11 months) between the studied price and both indices, and introduce a linear trend and intercept terms. The best model has the smallest RMS error between July 2003 and October 2012. The complete set includes the headline and core CPI, all major categories from food to other goods and services, and many minor subcategories with long enough history (i.e. continuous estimates should be available since 2001).
We have borrowed the time series of monthly closing prices of NU from Yahoo.com (October 2012 is included) and the CPI estimates through October 2012 are published by the BLS. The best-fit models for NU(t) in March and October are as follows:
NU(t) = -2.57SEVF(t-6) + 0.97HOS(t-7) + 15.18(t-2000) + 267.79, March 2012
NU(t) = -2.60SEVF(t-7) + 0.98HOS(t-8) + 15.25(t-2000) + 268.06, October 2012
where NU(t) is the NU share price in U.S. dollars, t is calendar time. The changes in the model are just minor with the same principal CPIs, very close time lags, and slightly changed coefficients. One can conclude that the data for the past seven months have validated the original model.
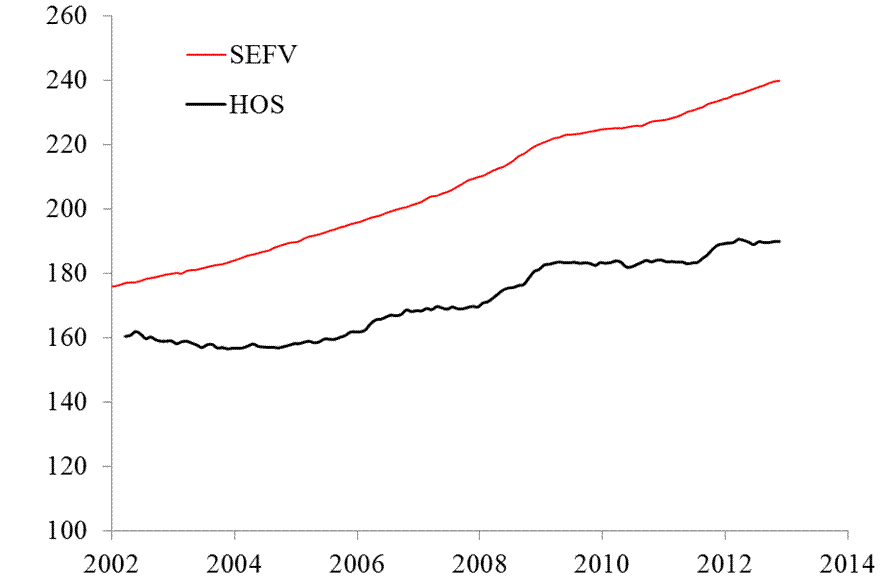
Figure 1 displays the evolution of both defining indices since 2002. The housekeeping supplies index has a positive influece on the price, i.e. the growth in HOS results in a higher NU price. Apparently, the negative slope of SEFV implies that higher food prices reduce the NU return. This is not against common sense.
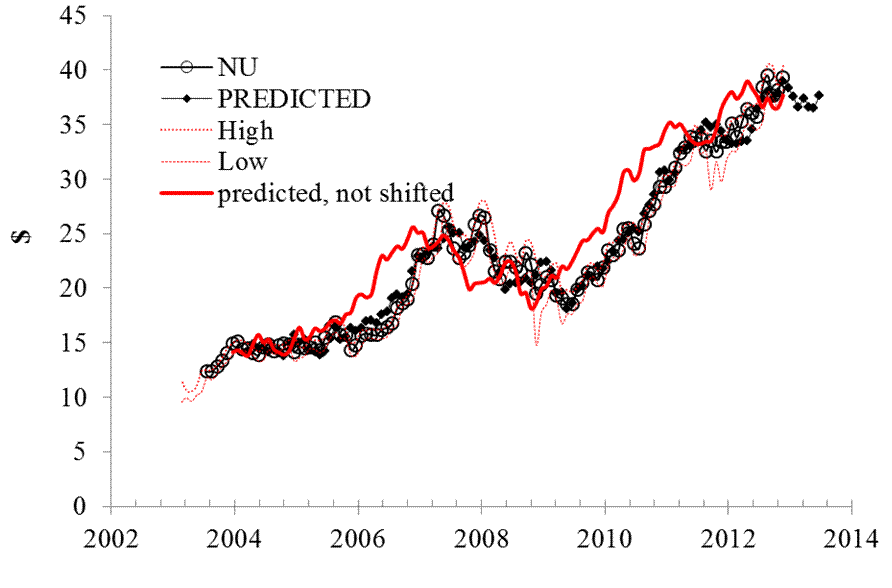
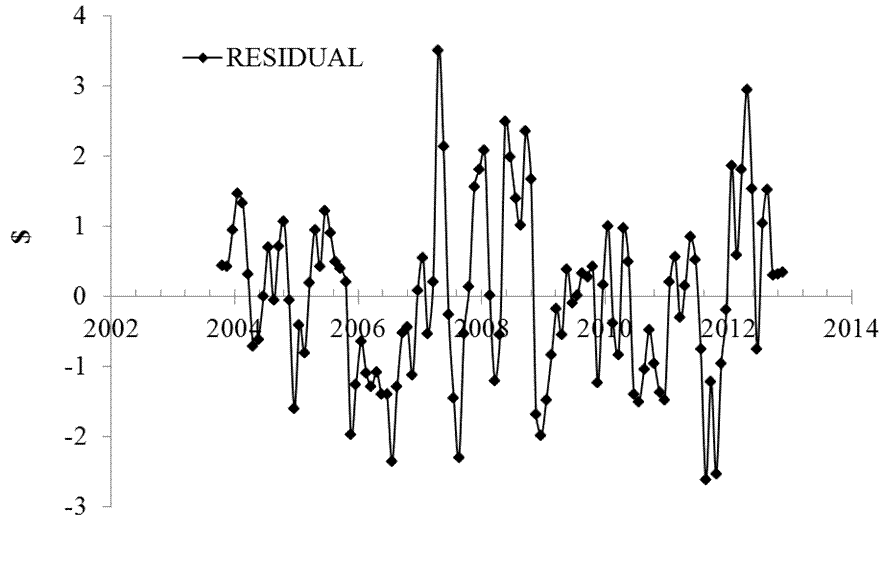
Figure 2 depicts the high and low monthly prices for a NU share together with the predicted and measured monthly closing prices. The high/low prices put natural limits for the variation of the monthly price. The predicted prices are well within the high/low share price curves. The model residual error is shown in Figure 3 with the standard error between July 2003 and October 2012 of $1.20 (in March, the error was $1.23). All in all, the model is very accurate and all deviations are promptly recovered, i.e. the measured curve returns to the predicted one, which leads by seven months. One can foresee the share price behaviour seven months ahead, as shown by solid red line representing a contemporary prediction of the price.
Considering Figure 2, one can conclude that the price should fall in the fourth quarter of 2012 to the level of $37 per share. It will likely stay that level in 2013Q1. 


- English (UK)
- English (India)
- English (Canada)
- English (Australia)
- English (South Africa)
- English (Philippines)
- English (Nigeria)
- Deutsch
- Español (España)
- Español (México)
- Français
- Italiano
- Nederlands
- Português (Portugal)
- Polski
- Português (Brasil)
- Русский
- Türkçe
- العربية
- Ελληνικά
- Svenska
- Suomi
- עברית
- 日本語
- 한국어
- 简体中文
- 繁體中文
- Bahasa Indonesia
- Bahasa Melayu
- ไทย
- Tiếng Việt
- हिंदी
Northeast Utilities May Fall To $37 Per Share By 2013
Published 11/18/2012, 04:17 AM
Updated 07/09/2023, 06:31 AM
Northeast Utilities May Fall To $37 Per Share By 2013
3rd party Ad. Not an offer or recommendation by Investing.com. See disclosure here or
remove ads
.
Latest comments
Install Our App
Risk Disclosure: Trading in financial instruments and/or cryptocurrencies involves high risks including the risk of losing some, or all, of your investment amount, and may not be suitable for all investors. Prices of cryptocurrencies are extremely volatile and may be affected by external factors such as financial, regulatory or political events. Trading on margin increases the financial risks.
Before deciding to trade in financial instrument or cryptocurrencies you should be fully informed of the risks and costs associated with trading the financial markets, carefully consider your investment objectives, level of experience, and risk appetite, and seek professional advice where needed.
Fusion Media would like to remind you that the data contained in this website is not necessarily real-time nor accurate. The data and prices on the website are not necessarily provided by any market or exchange, but may be provided by market makers, and so prices may not be accurate and may differ from the actual price at any given market, meaning prices are indicative and not appropriate for trading purposes. Fusion Media and any provider of the data contained in this website will not accept liability for any loss or damage as a result of your trading, or your reliance on the information contained within this website.
It is prohibited to use, store, reproduce, display, modify, transmit or distribute the data contained in this website without the explicit prior written permission of Fusion Media and/or the data provider. All intellectual property rights are reserved by the providers and/or the exchange providing the data contained in this website.
Fusion Media may be compensated by the advertisers that appear on the website, based on your interaction with the advertisements or advertisers.
© 2007-2024 - Fusion Media Limited. All Rights Reserved.
