
Nonfarm payrolls days have been more volatile than normal trading days in 2012, but the record is not consistent. Could yesterday’s volatility yield to today’s choppy ranginess? Depends on the data, of course.
The Bundesbank was out this morning announcing a revision lower to its 2013 GDP forecasts to 0.4% from 1.6% previously. EURUSD responded with a fresh move to new lows. The 1.3000 level has suddenly been taken out again, and some of the acceleration lower yesterday was also about developments in Italy, not just about Draghi’s ho-hum appearance at the press conference yesterday and his mention of a “wide discussion” of an interest rate move (meaning that the odds for a move need to be priced in more, hence a chunky 6 tick rise in Dec 2013 Euribor yesterday that was a fundamental support for the move lower). In Italy yesterday, Berlusconi asked his party faithful to abstain from voting on Monti reform bills. The apparent power gambit could be aimed at provoking a crisis that will result in a snap election as early as next month or in February rather than the March time frame that was previously assumed. Finally, it appears that the EU tail-risk pendulum is swining back toward fear from the recent, rather extreme, complacency Italian 10-yr yields are higher again this morning by several bps and this remains a developing story.
Chart: EURUSD
With the 1.3000 level taken out, that level becomes resistance and the next focus is the sub-1.2800 area 200-day moving average in the bigger picture, though the 55-day moving average in view suddenly this morning might offer interim support if the trading remains cautious ahead of next week’s FOMC meeting.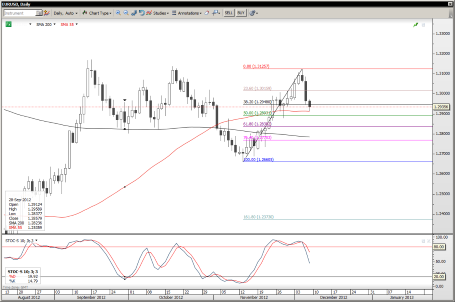 EUR/USD" title="EUR/USD" width="455" height="302">
US payrolls day – should we bother to react?
The legend goes that the US payrolls data is the most important data of the month, and it seems to me that many of the payrolls days have turned out to be days like any other – but memory and reality aren’t always compatible, so I went to the trouble to quantify volatility on nonfarm payrolls day, using Bloomberg data, which admittedly cuts off at 6 p.m. GMT, though that usually captures a good deal of the post-employment number moves, anyway.
Using EURUSD as our instrument of choice, I took the trading range (simply high-low as pct of previous day’s close) relative to the simple 50-day moving average of the daily trading ranges. The 11 nonfarm payrolls days thus far in 2012 have seen volatility – on average – about 20% greater than average true range. There were four exceptionally volatile nonfarm days: in March (1.54x normal), June (1.72x), August (1.91x) and September (1.63x). The rest were unremarkable, except for April’s, which saw about 0.6 (!) of the normal trading range in EURUSD. In any case, except for August, every exceptionally volatile nonfarm Friday had a quieter than usual day on Thursday. (this is noteworthy, as we have just seen an exceptionally volatile pre-nonfarm Thursday…)
Only in August’s case did we see a volatile day before nonfarm and a volatile nonfarm day itself – but if you recall, there was an FOMC meeting that Wednesday as the market was trying to gauge the likelihood of an impending QE3. For those four months of larger than normal volatility, the surprise was also significant in all except March’s case:
- March (227k vs. 210k exp. and +41k revision to prev. month)
- June (69k vs. 150k exp. and large -38k revision to prev. month)
- August (163k actual vs. 100k exp.)
- September (96k vs. 130k exp. But Unemployment falls to 8.1% vs. 8.3% exp.)
However, it is important to point out, that the month’s with the very largest data surprises – February and April, failed to generate above average volatility in EURUSD on the day of the employment report release – though USDJPY did trade in a much wider than average range in those two cases.
By the way, USDJPY looked slightly different from EURUSD in 2012, with nonfarm day producing more volatility (35% more on average), but USDJPY’s trading ranges have also been more compressed than EURUSD’s in 2012.
So what about today’s US employment report?
Today’s report will inevitably be filtered for superstorm Sandy effects, so it will take a considerable negative surprise – well below 50k – to push the market to the negative side. Anything well above 100k will be seen as a positive surprise and could see USDJPY rallying strongly if bonds sell off. The EURUSD reaction is less clear-cut in a positive payrolls scenario. I said recently that the potential for a large reaction to today’s report was there due to the USD’s extreme weakness of late, but now that it has moved sharply to the strong side, the reaction potential may be somewhat reduced, particularly with the FOMC meeting next week in the pipeline. Also keep an eye on the unemployment rate.
USDCAD near historic lows in volatility
Yesterday saw a cautious probe by USDCAD below the 0.9900 level before a downright awful Ivey PMI put in a little support. I’ve remarket lately about the amazing lack of volatility in USDCAD and I was finally prompted to determine how unprecedented the situation there is. Prior to today, the trading range of the previous nine trading days was a mere 0.70%. This was the smallest nine-period trading range (measured as a per cent, not in pips) since February of 2002, when USDCAD was in a sluggish topping process (would you believe in the 1.60 area) before it began sliding toward 1.51 from late spring and into early summer (a low that it didn’t break until the following year when the great USD sell-off finally got going in earnest. Looking at USDCAD, the structural situation is fairly dead, with a real parity break needed to wake up the market and a move above the 1.04/1.05 zone to get things going in earnest again. One thing is for sure – volatility is cheap relative to history (closing in on 7% implied for 1-yr), though it was even cheaper back in 2007, when it actually dipped below 6% briefly.
Looking ahead
Today also sees the release of Canadian employment data, and given the steep dip in oil prices and an awful Ivey PMI released yesterday (actually in recessionary territory, though the market has been trained to wait through one bad Ivey survey as the record for this data series is more than a bit volatile.) CAD has only survived intact here because of the Ugly Contest going on in among the G-3 currencies at the moment. But can the CAD escape negative attention on a weak employment report today if risk is also on the defensive? I fail to see how…
The next key event risk remains next Wednesday’s FOMC meeting with questions over what replaces Operation Twist looming (a mere extension or back to the treasury buying). Then we have the SNB meeting on Thursday. Questions on the fiscal cliff also become more pressing next week as the end of the year nears. The latest gambit comes from Geithner, who said that Obama is willing to go over the cliff rather than give in to Republican demands.
Stay careful out there and have a wonderful weekend.
Economic Data Highlights
- Australia Nov. Performance of Construction Index out at 37.0 vs. 35.8 in Oct.
- Australia Oct. Trade Balance out at -2088M vs. -2200M expected and -1420M in Sep.
- Switzerland Nov. Foreign Currency Reserves out at 424.8B vs. 422B expected and 424.4B in Oct.
- Norway Oct. Industrial Product Manufacturing out at -0.3% MoM and +2.7% YoY vs. +2.4% YoY in Sep.
- UK Oct. Manufacturing Production out at -1.3% MoM and -2.1% YoY vs. -0.2%/-0.2% expected, respectively and vs. -1.7% YoY in Sep.
- Germany Oct. Industrial Production (1100)
- Canada Nov. Unemployment Rate (1330)
- Canada Nov. Employment Change (1330)
- US Nov. Change in Private and Nonfarm Payrolls (1330)
- US Nov. Unemployment Rate (1330)
- US Nov. Average Hourly Earnings and Average Weekly Hours (1330)
- US Dec. Preliminary University of Michigan Confidence (1455)
- US Oct. Consumer Credit (2000)