Home country investment bias has been written about in behavioral finance segments for years. A home country bias infers investors prefer local investments because they feel more familiar with the markets and potential opportunities over nondomestic alternatives.
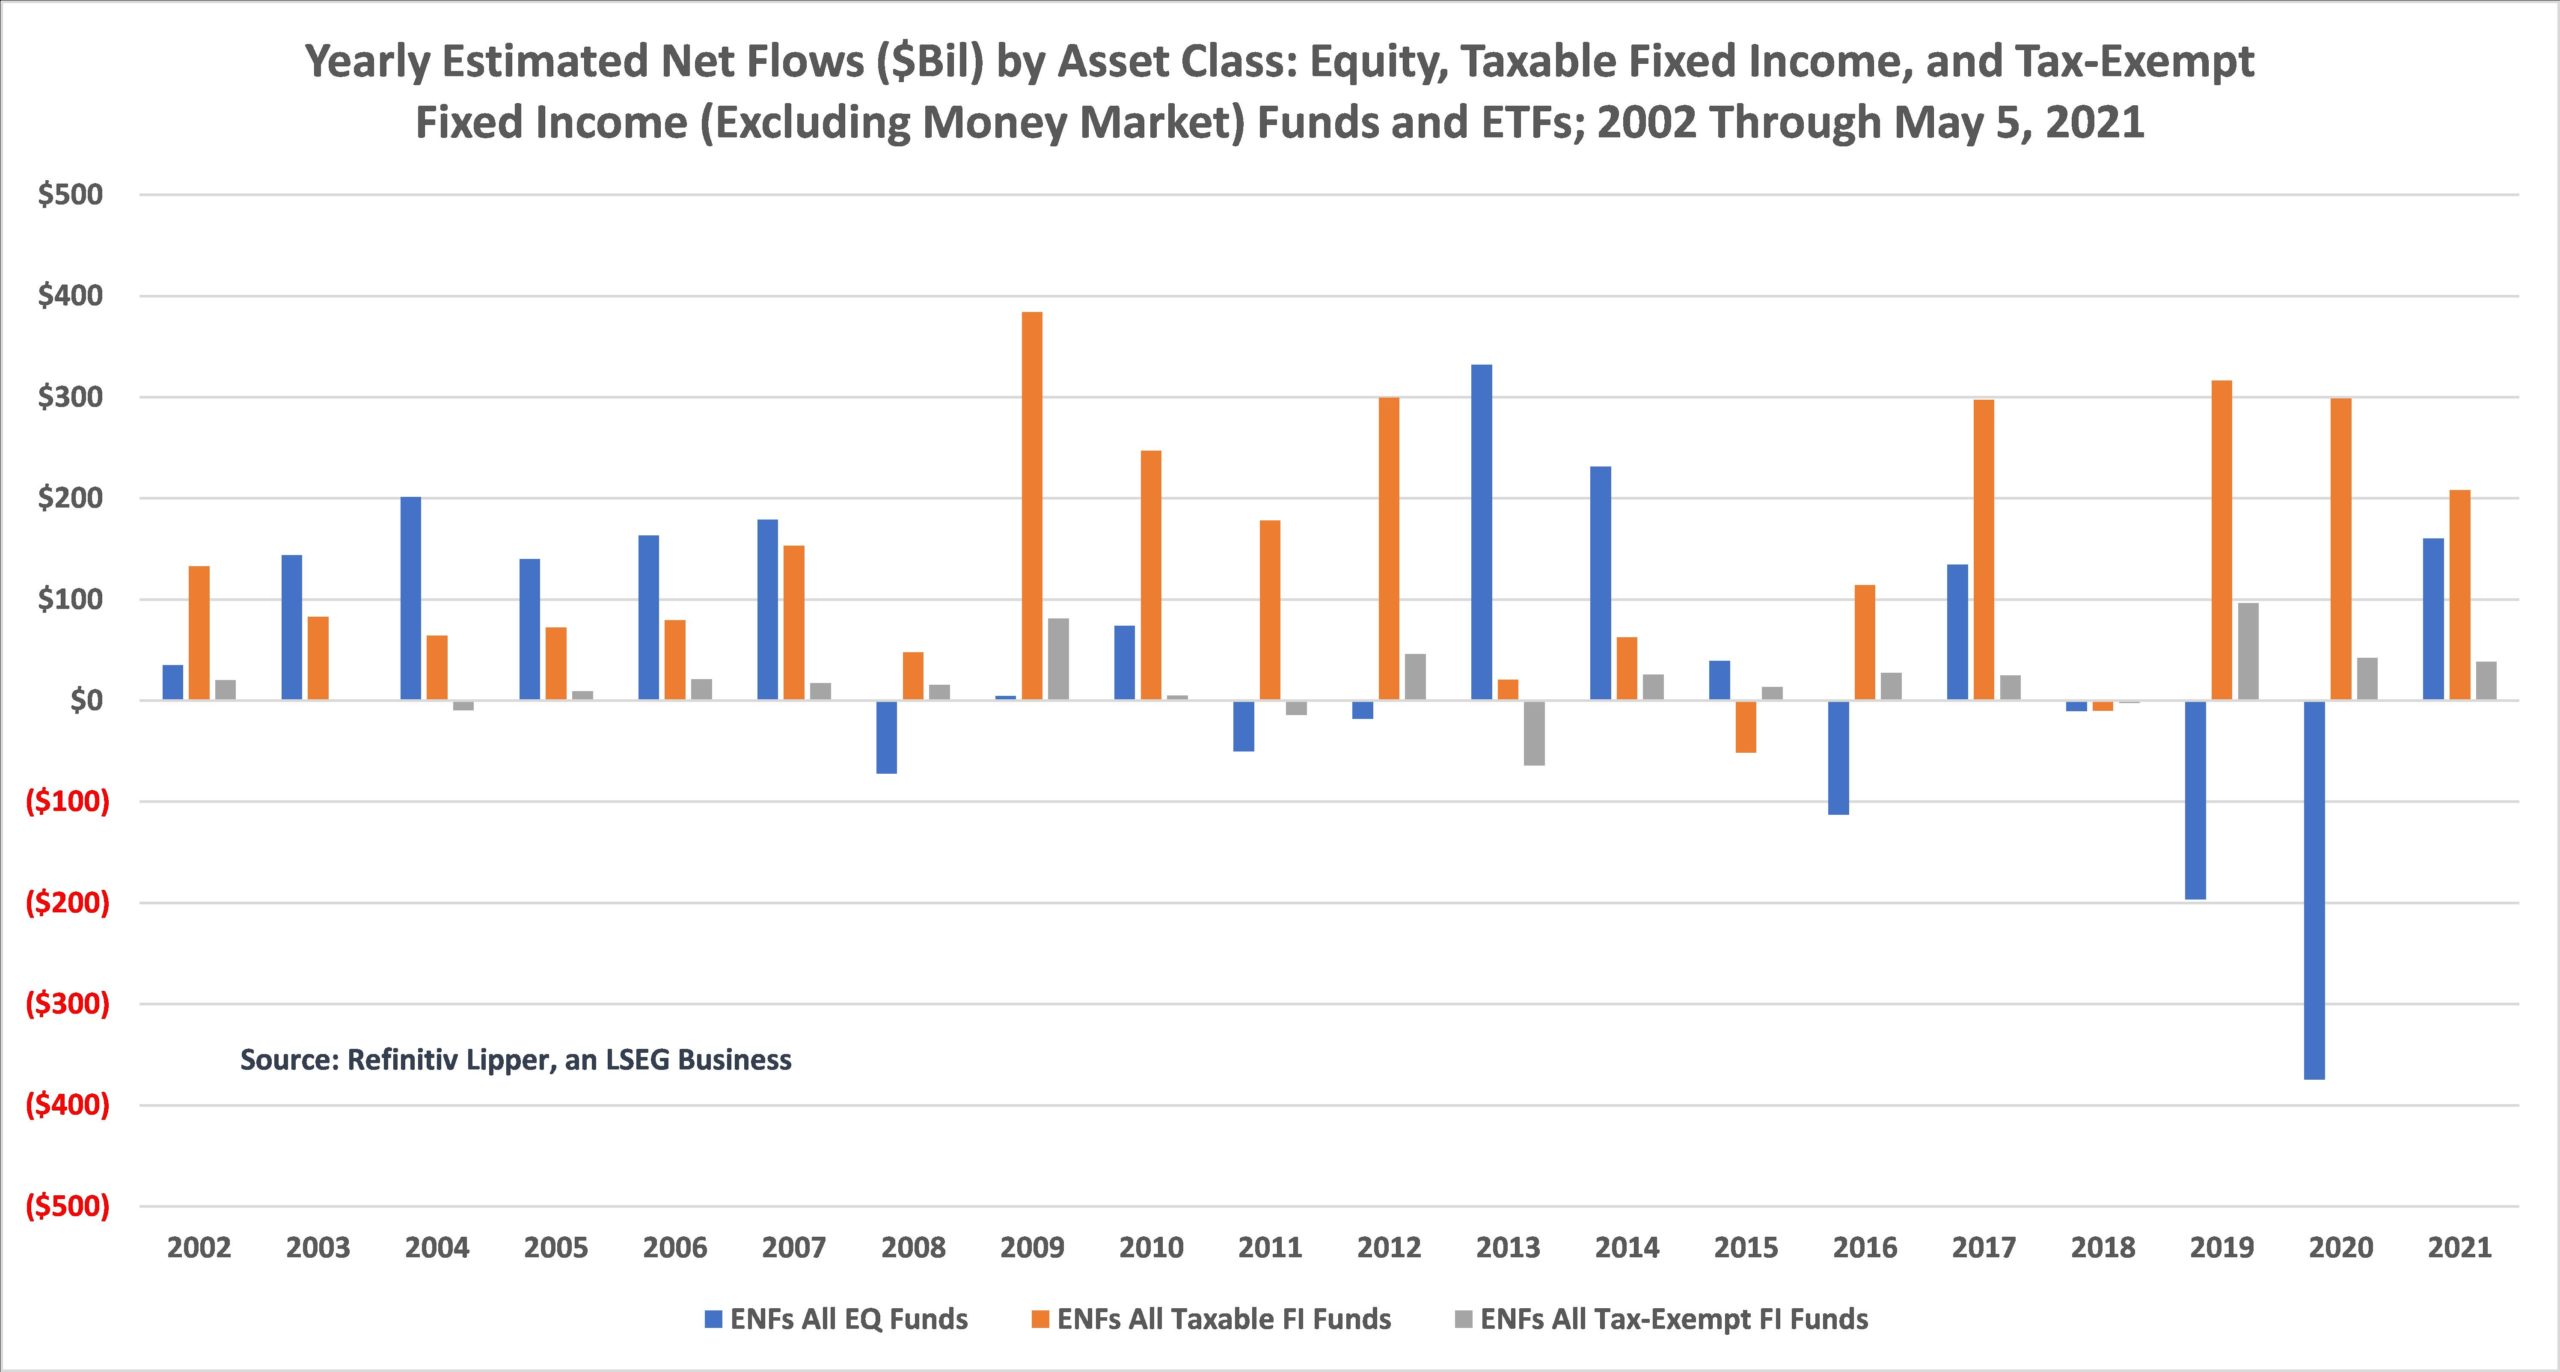
However, for years financial planners and investment advisors have encouraged investors to branch out of their core investment asset classes to include non-, or at least lower, correlated assets to their domestic, usually large-cap, core holdings, including smaller-cap issues, fixed income securities, REITs, commodities, alternative investments, and yes, international holdings. Researchers have shown that a well-diversified portfolio provides lower risk accompanied by higher returns over the long haul.
And over the years, we have commented on the exodus out of large-cap equity funds and into fixed income funds and other asset classes as investors have diversified their holdings. Most recently, though, there has been a lot of focus on the move from active to passively managed products. This has been evident in the more well covered large-cap space, where competitive advantages are gobbled up almost instantaneously, but less often seen in taxable fixed income funds, municipal bond funds, and sometimes international issues.
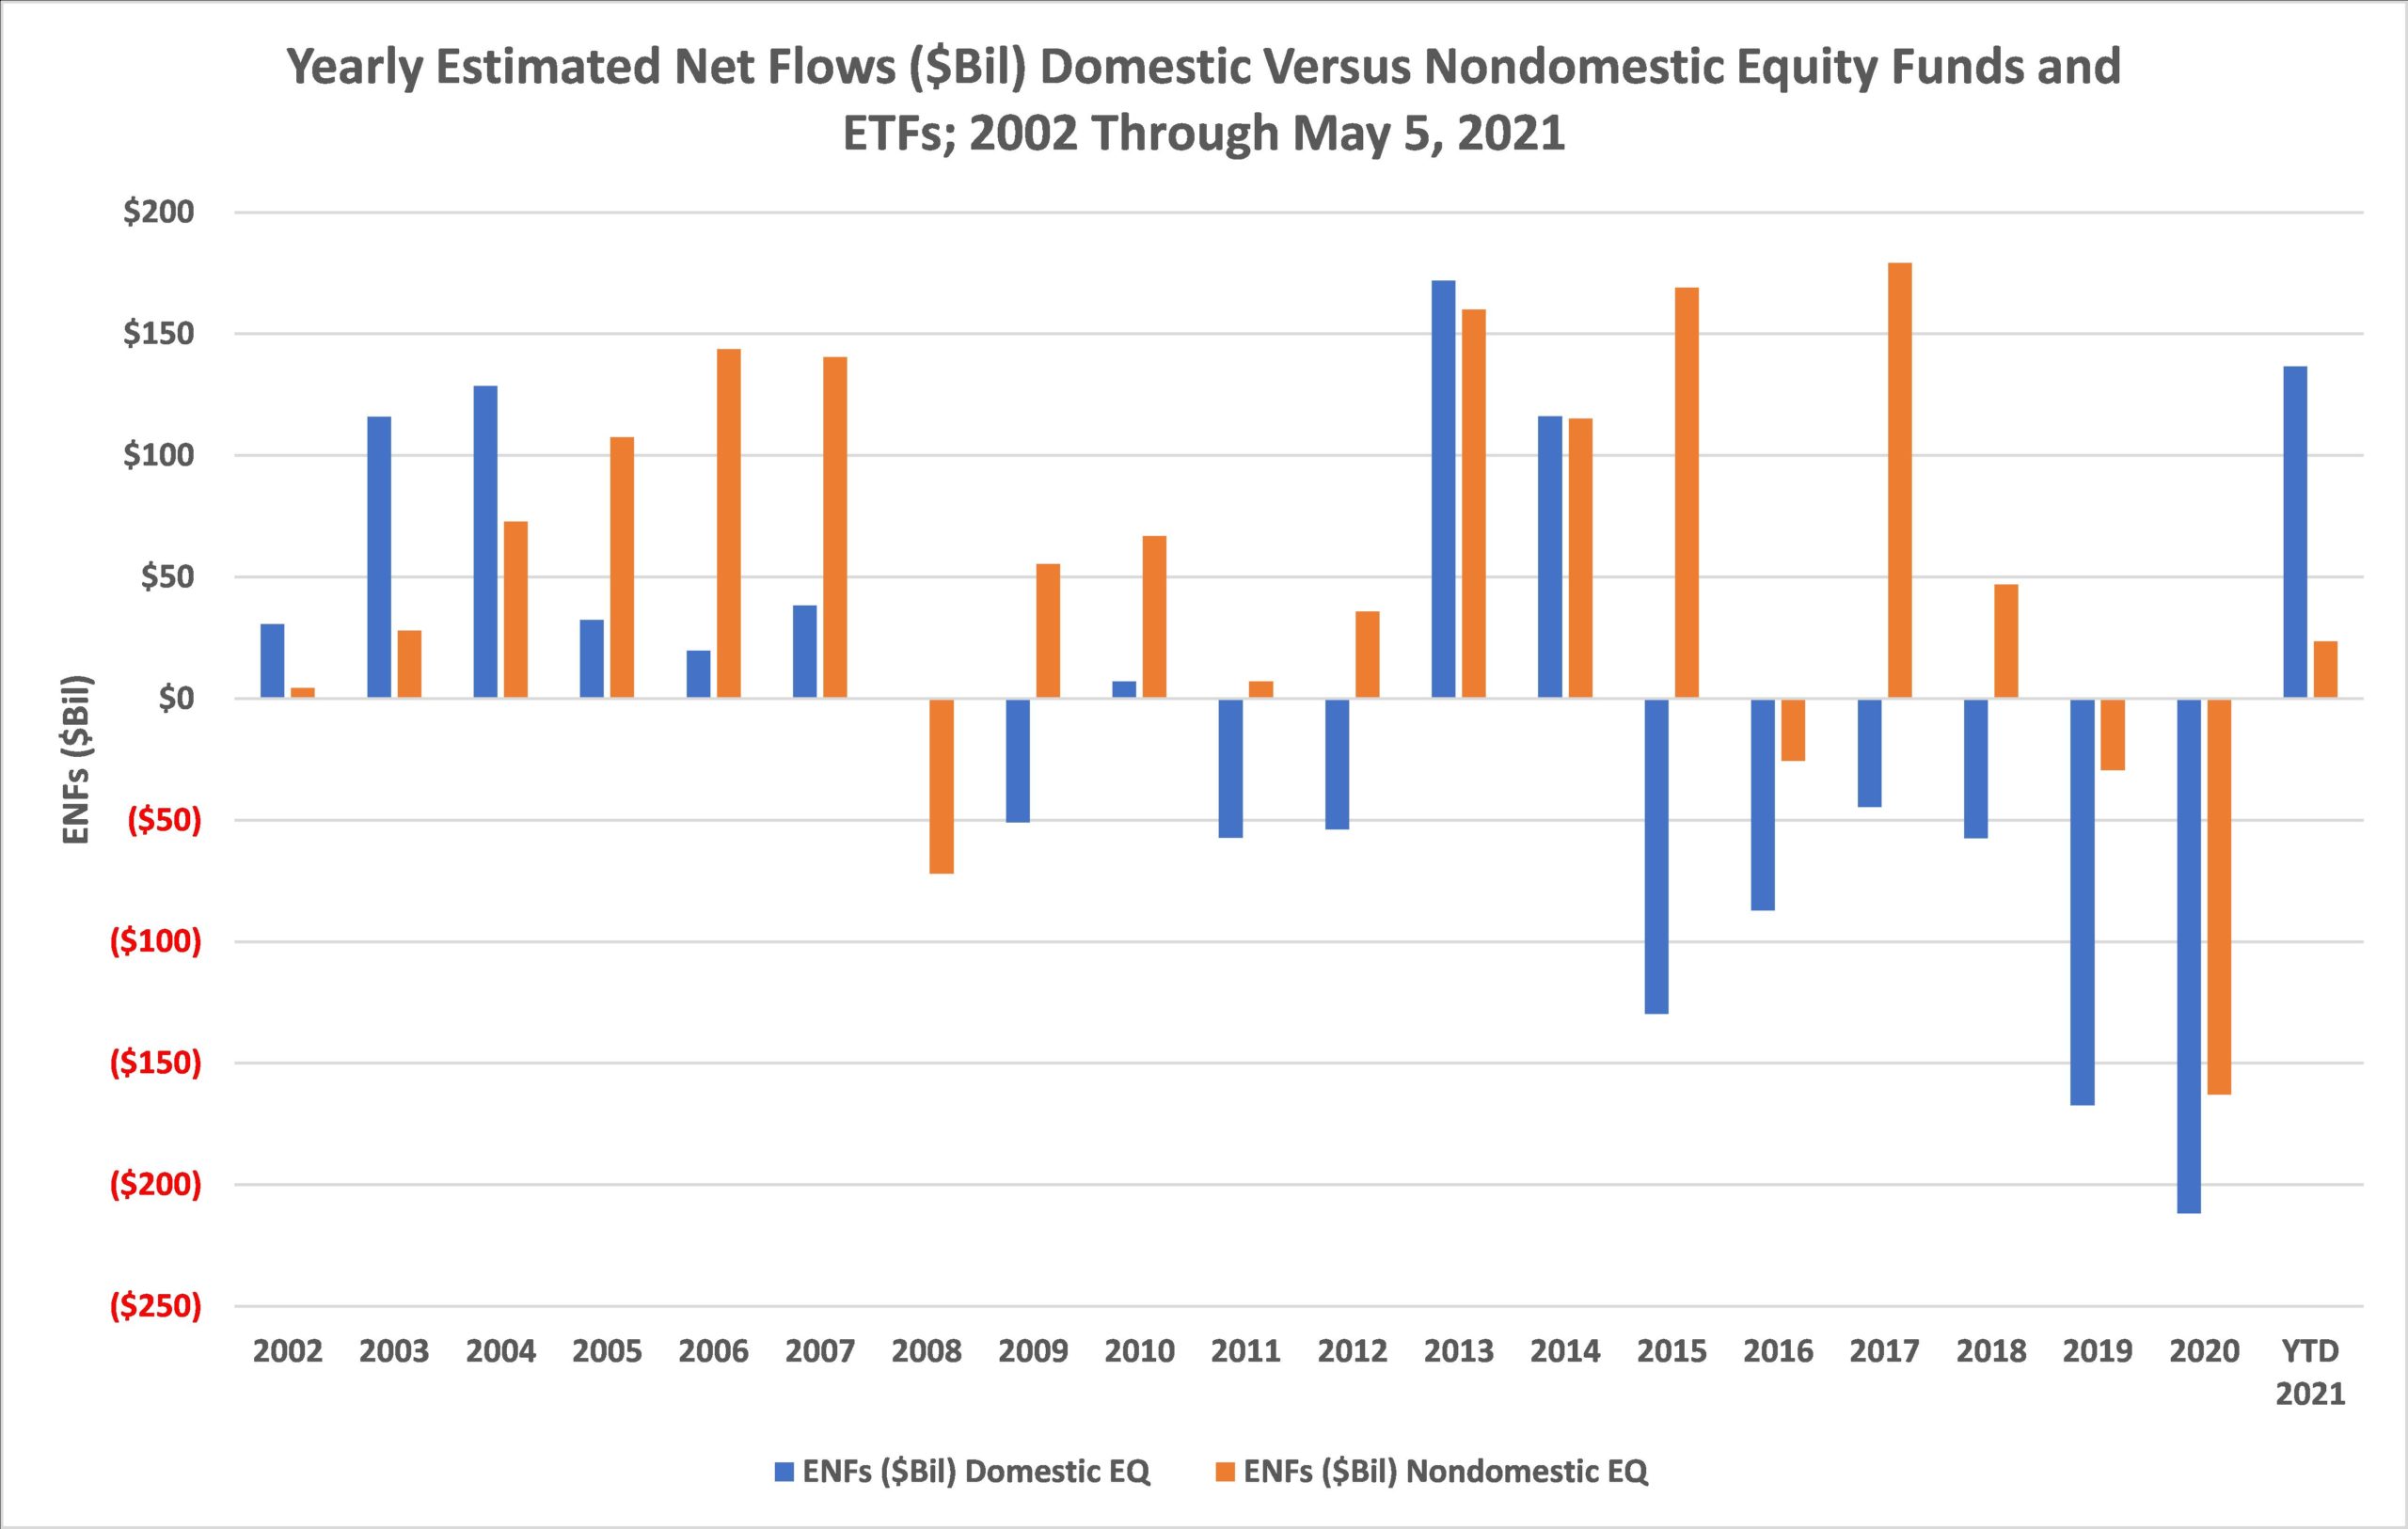
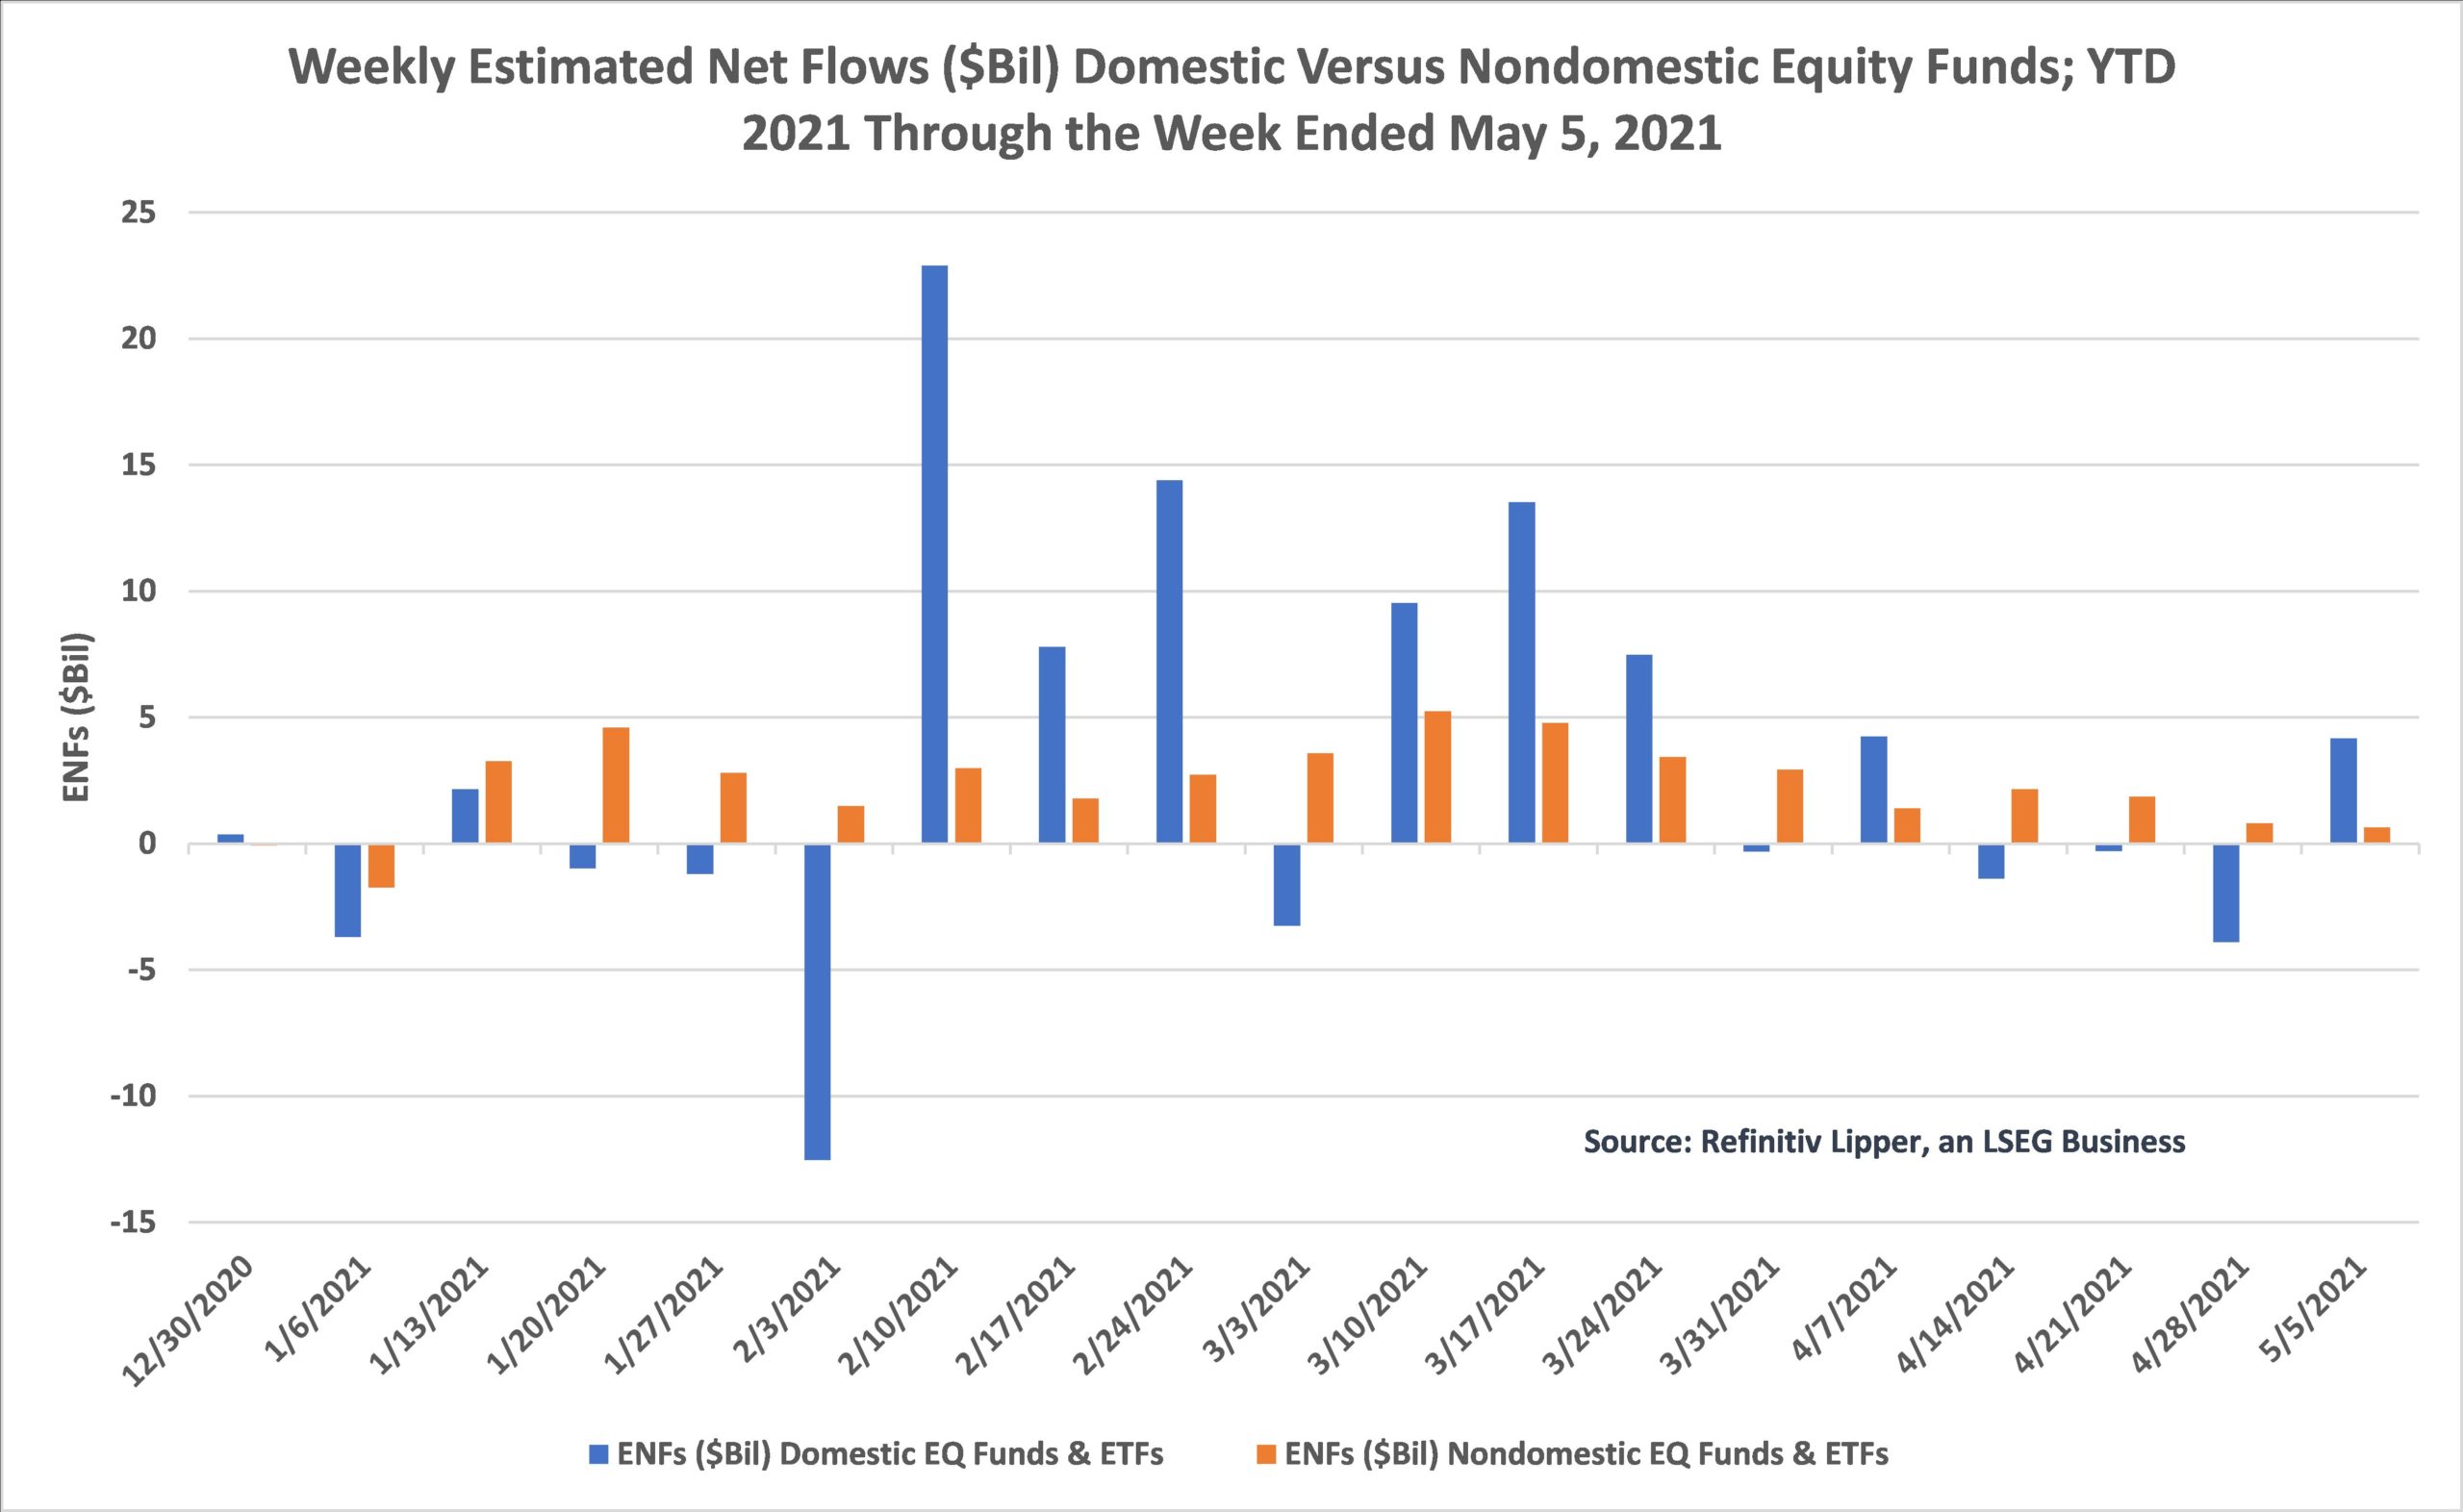
Over the last several years, we have seen a move from domestic equity funds (including ETFs) to nondomestic equity funds. That trend, however, changed in 2021—perhaps as a result of COVID-19—and the rapid rebound by U.S. and other multinational companies, helped by the massive stimulus packages signed into law by political leaders. The strong performance seen in predominantly U.S. domiciled stay-at-home and quasi-related tech stocks, until the last several months, may have contributed to this change in trend.
Before we move on, it will be helpful to define the terms domestic and nondomestic funds. Most fund experts will tell you that a U.S. domestic fund invests primarily in U.S. companies, but can invest up to 25% of its assets under management in international investments. For ease of review, we wrap up international funds (which invest more than 75% of their assets under management outside of the U.S.) and global funds (which invest more than 25% but less than 75% outside of the U.S.) into one major group called nondomestic funds. And as we see in the chart below, since 2015 investors have shunned domestic equity funds and most years following, have favored nondomestic equity funds.
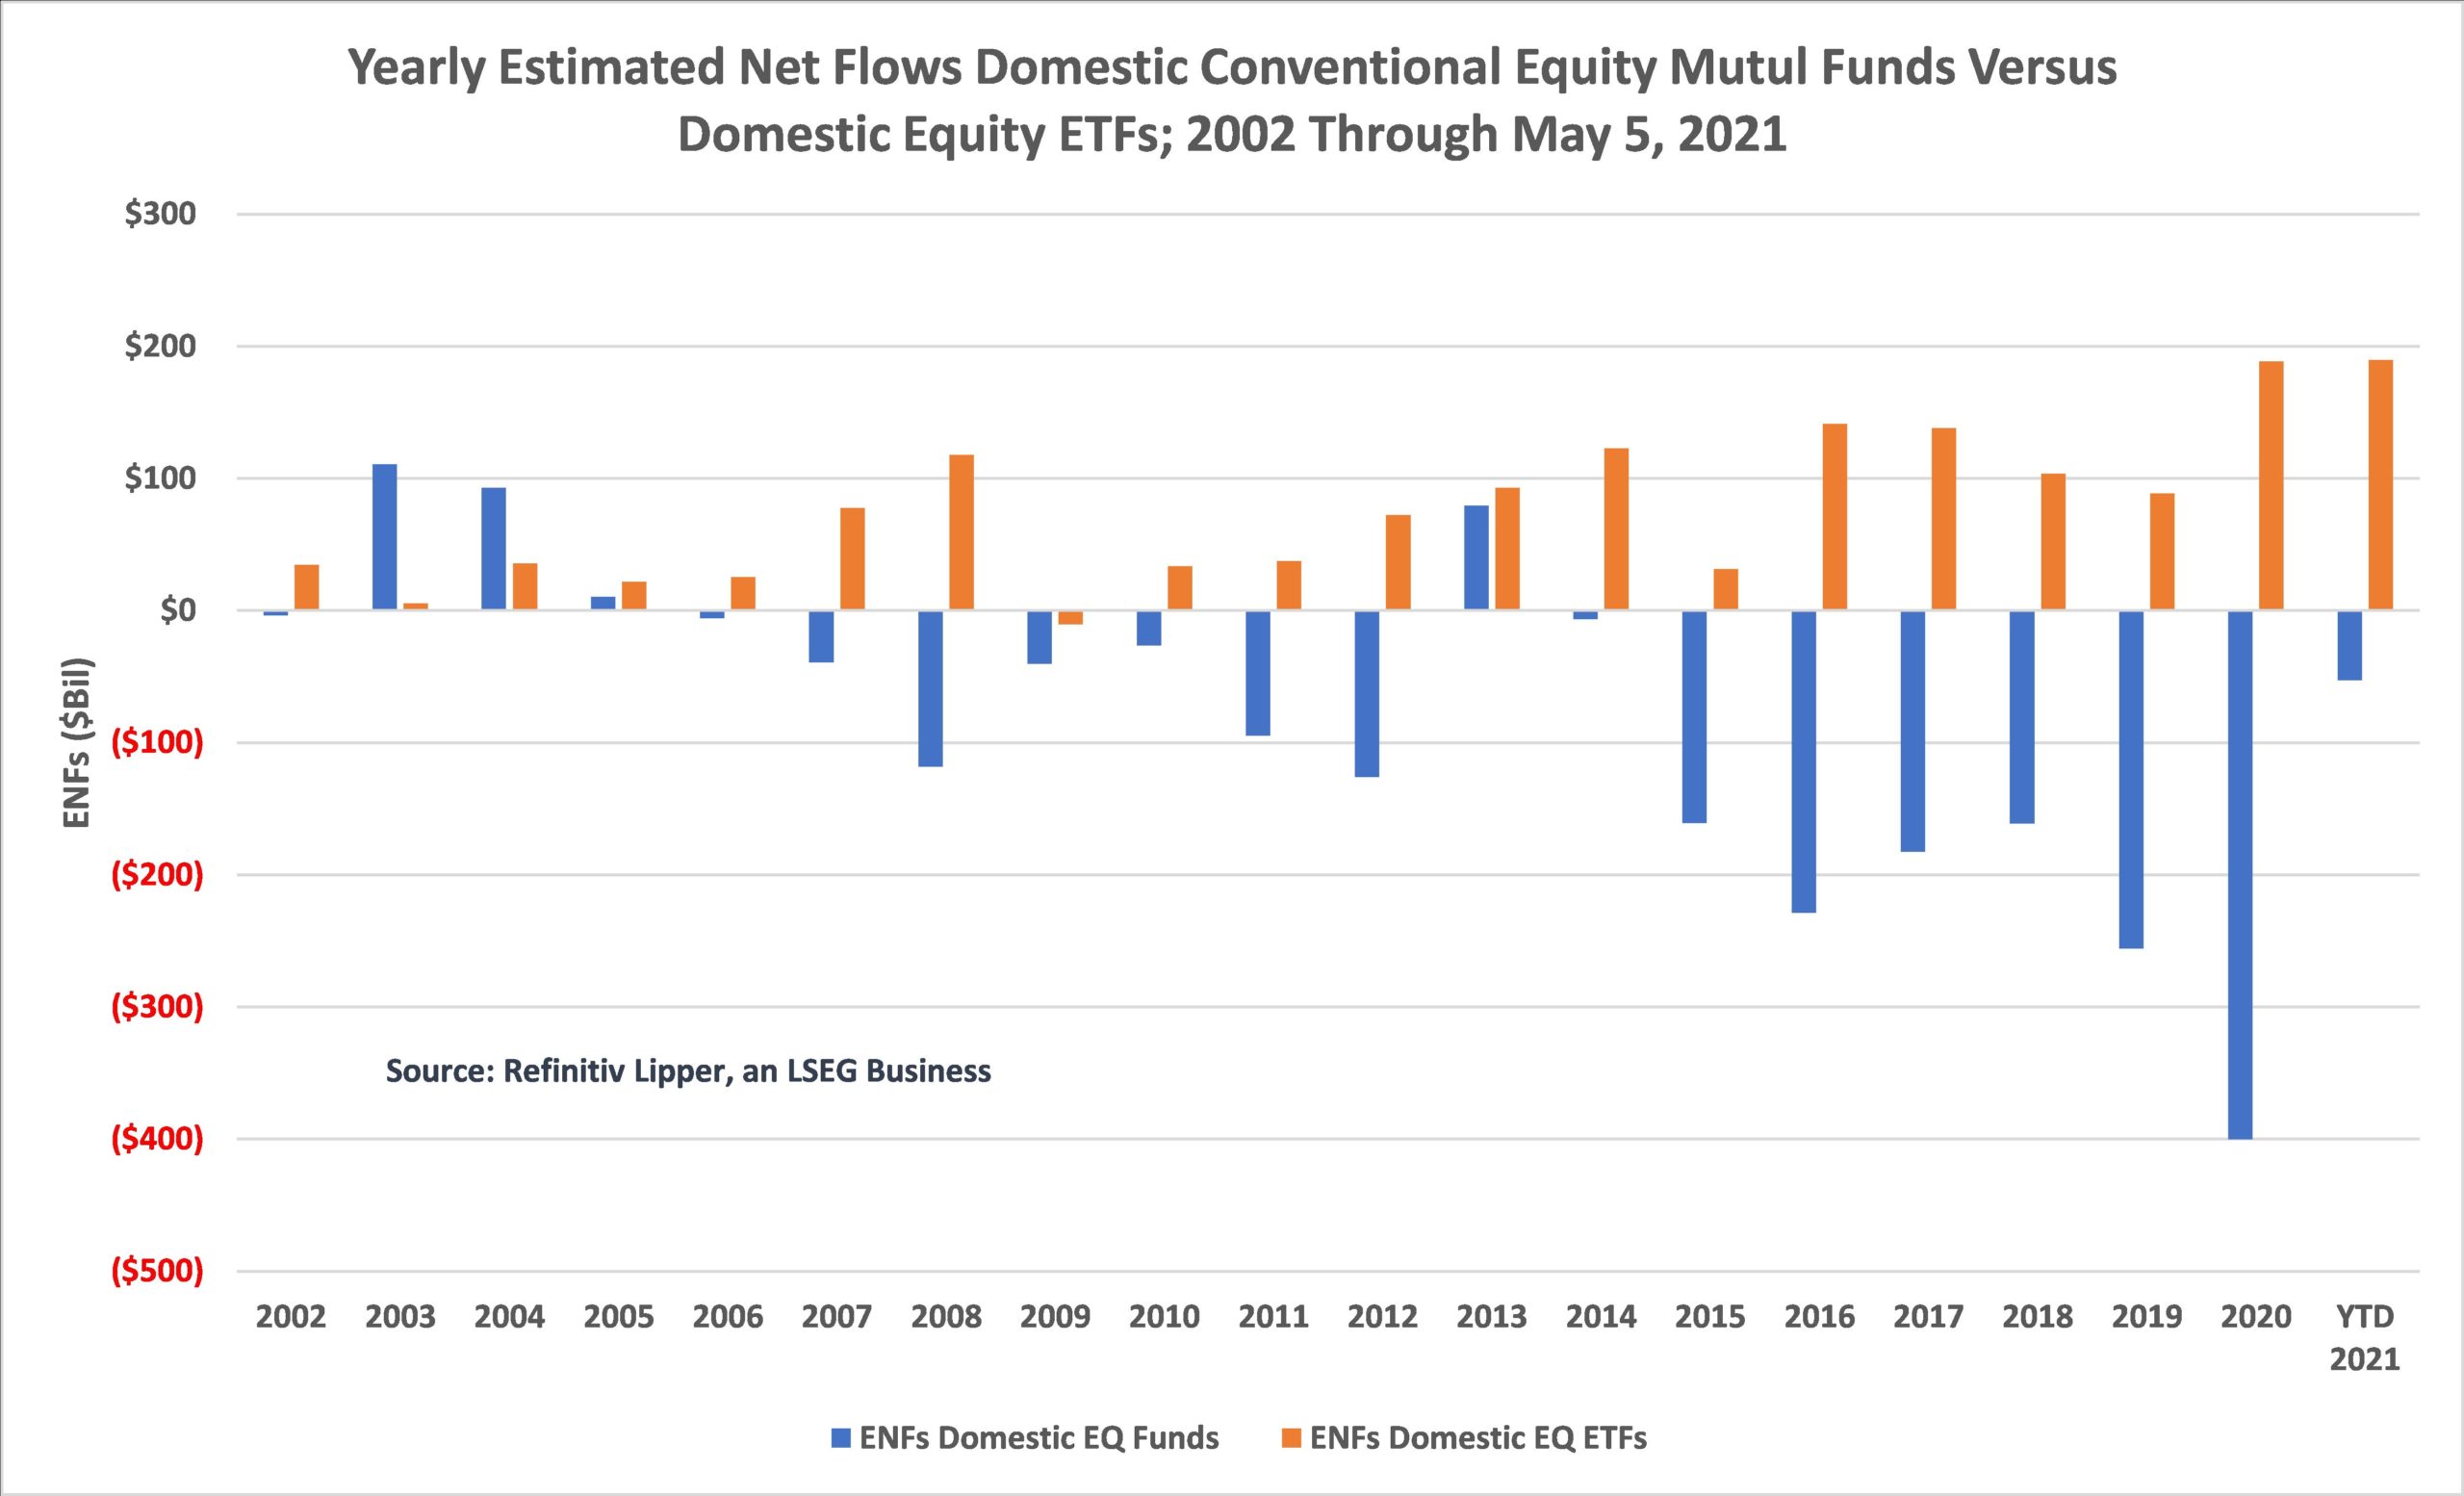
However, the trend toward using passively managed vehicles to add or subtract these different exposures becomes evident at a macro-level in the charts below. On the domestic equity side, conventional equity funds suffered net redemptions in each of the last eight years (including the 2021 year-to-date flows)—with combined outflows for that period of $1.450 trillion. Meanwhile, their domestic equity ETF counterparts have attracted net inflows in each of the last 12 years—with net inflows for the comparable eight-year period of $1.004 trillion.
But as we’ve highlighted in segments past, much of the net redemptions were witnessed in large-cap funds, which had become a very large part of the Baby Boomers’ core portion of their overall portfolios and were used to shift into the other asset classes, with a lot of the new money being tagged for equities shifting into ETFs.
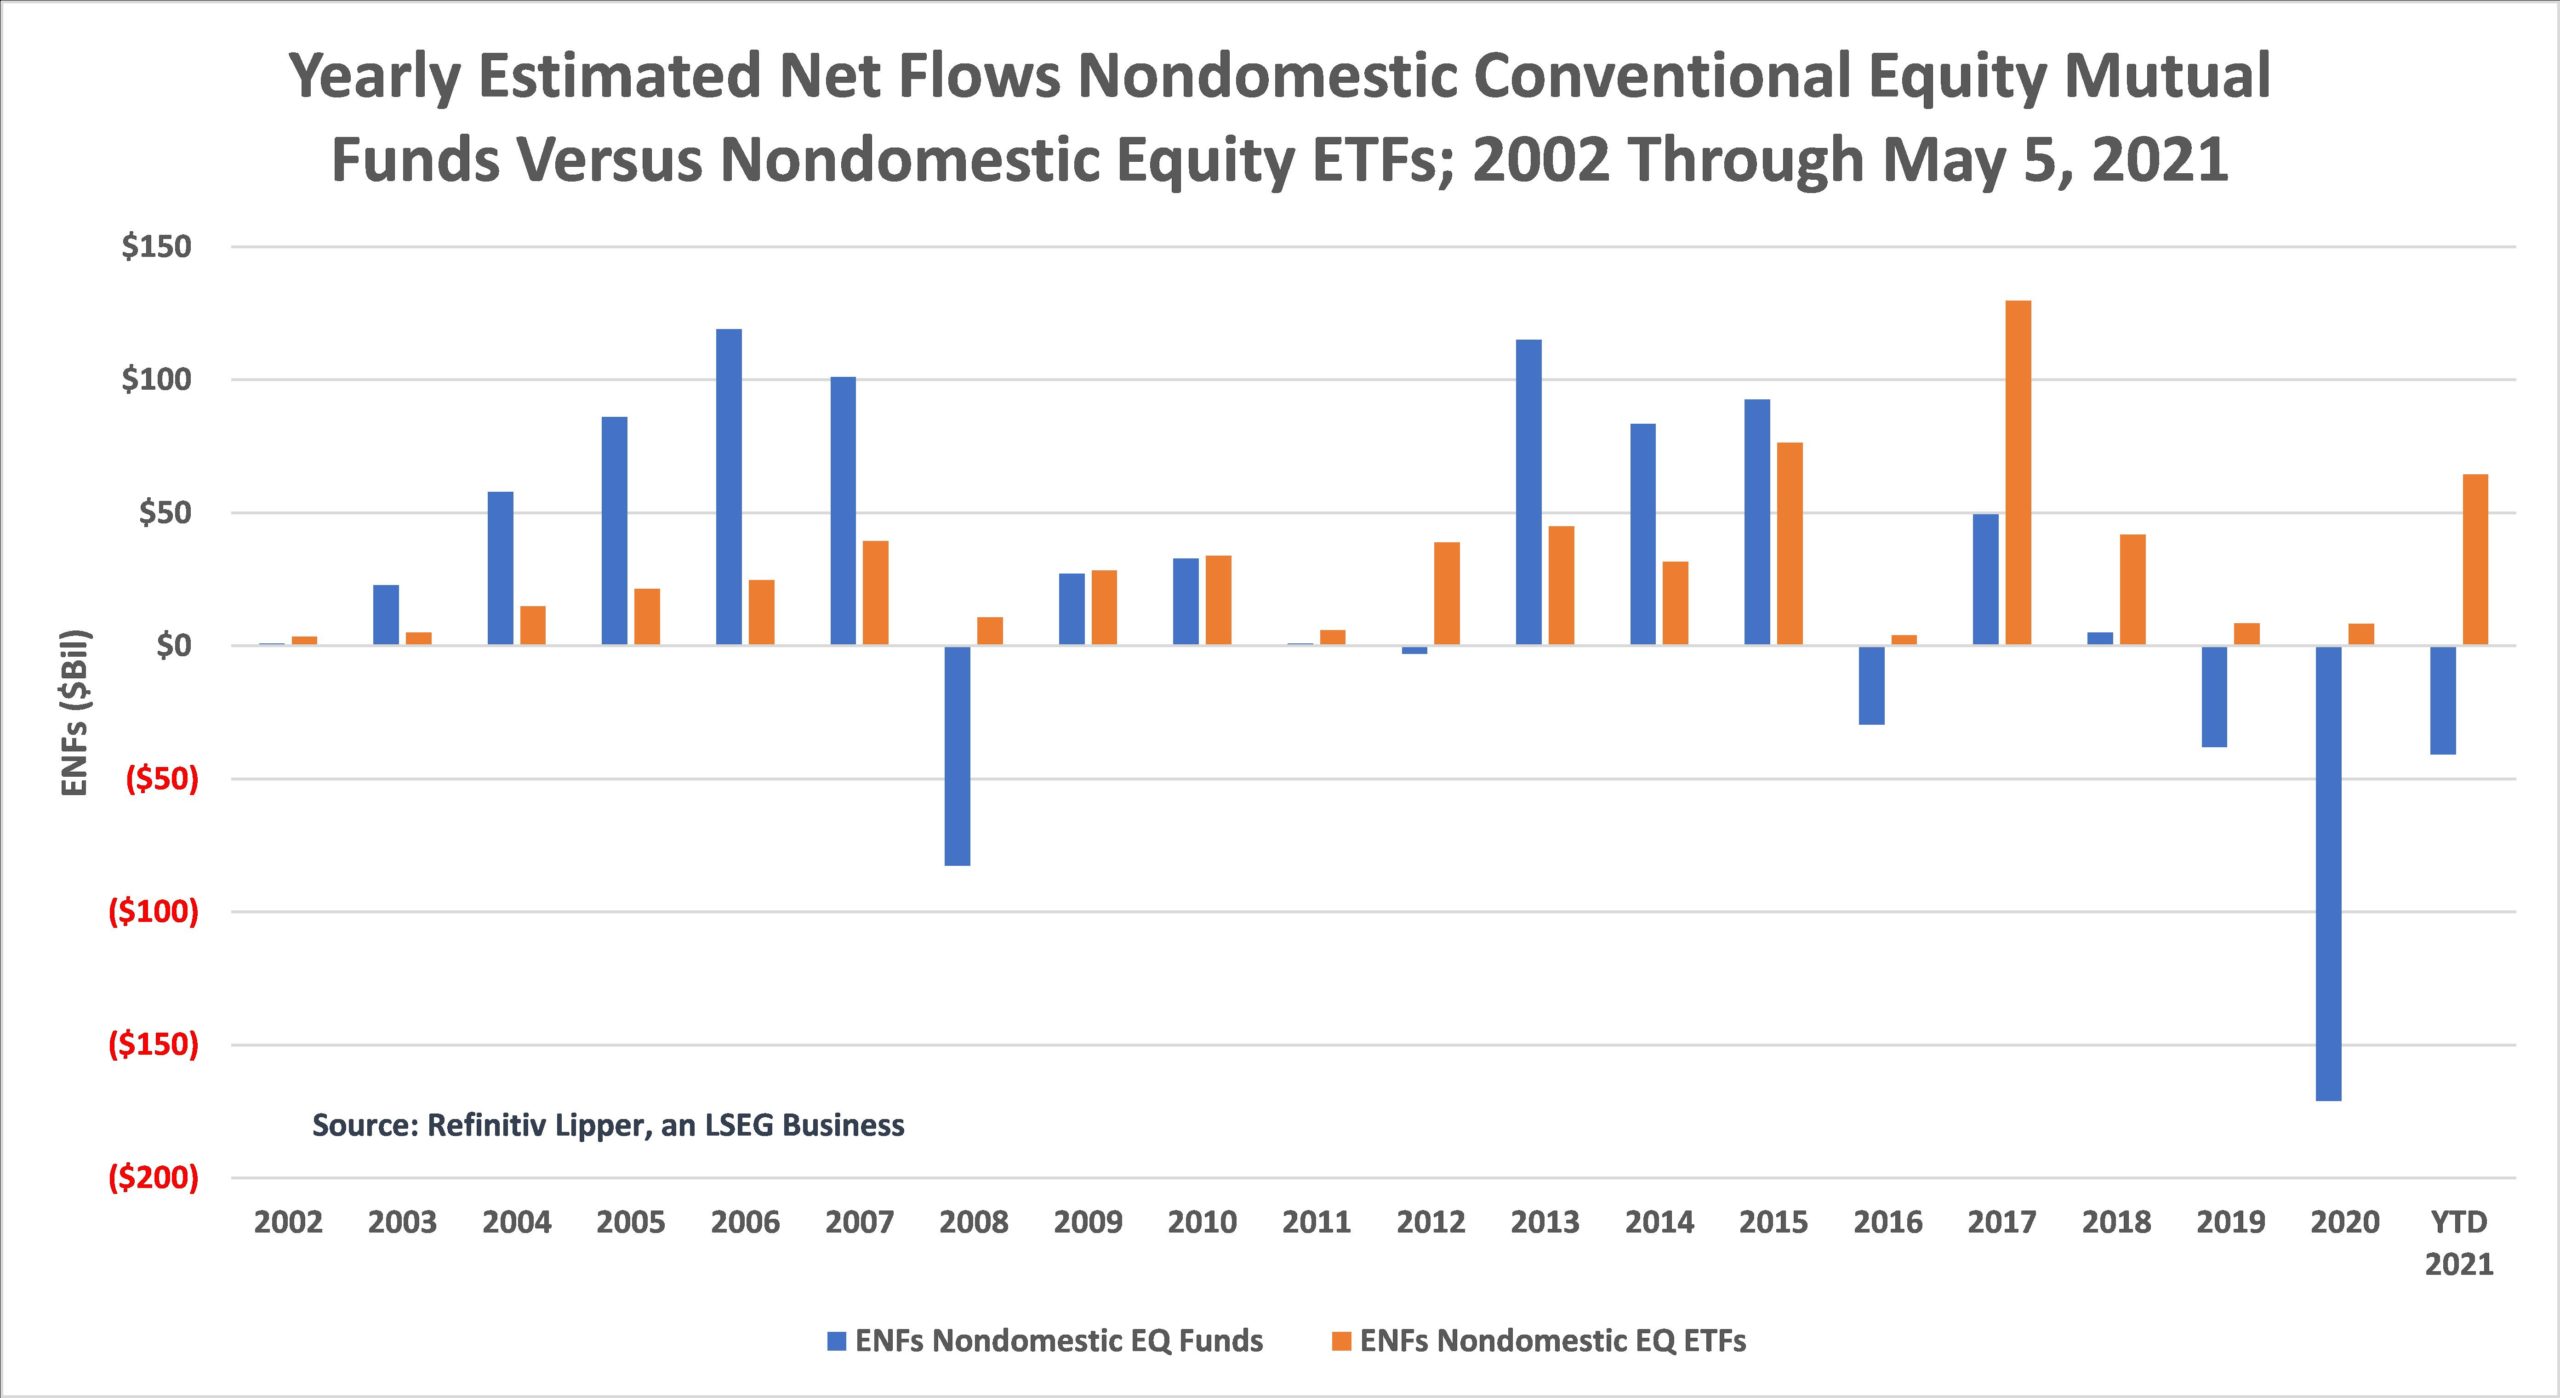
The differences aren’t quite as stark in the nondomestic equity fund comparison, where the nondomestic conventional equity funds group was only the pariah over the last three years. Nonetheless, the nondomestic equity ETFs attracted net new money in each of the last 20 years, attracting $639 billion, while their conventional equity funds counterparts took in only $429 billion during the same time frame.
That said, and ignoring the conventional funds versus ETF fund-flows trends, the recent move toward domestic equity funds in 2021 was helped by larger inflow trends earlier in the year and subject to large swings, whereas flows into the nondomestic equity funds, while smaller in comparison, were consistent and steady. So, the historical trend witnessed over the last several years of investors ongoing move away from home country bias continues, with nondomestic equity funds and ETFs only witnessing one week of net redemptions so far for 2021.

