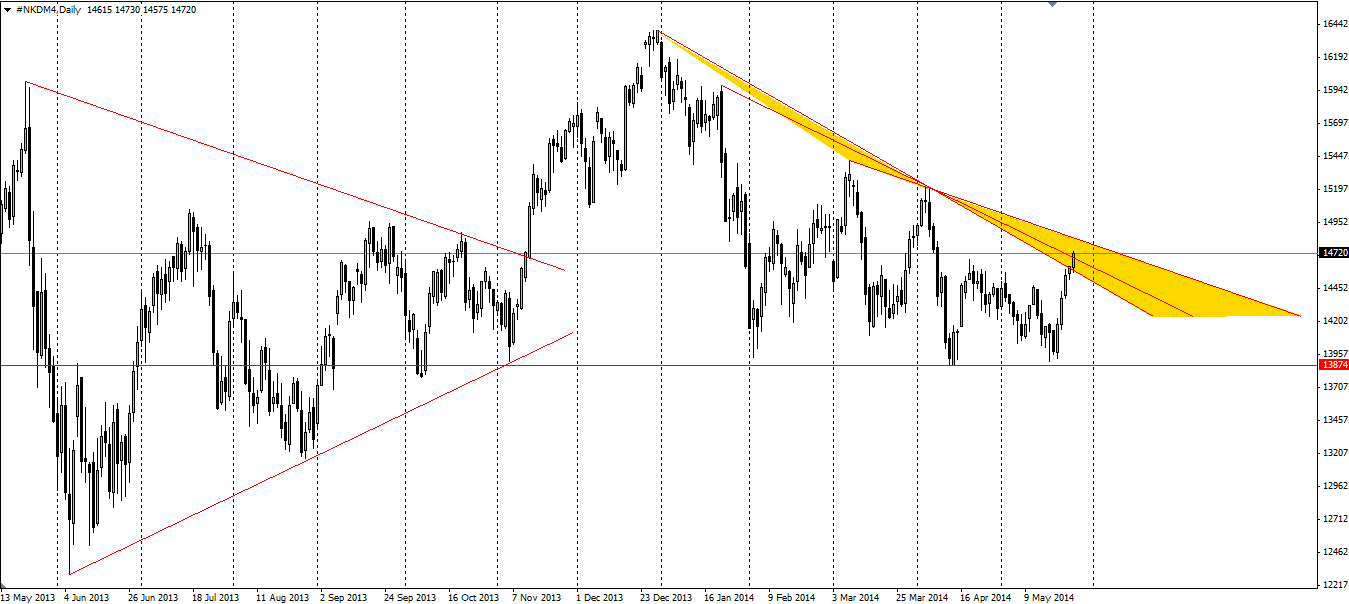
The Nikkei 225 futures (#NKDM4) has had its ups and downs over the past 7 months and it has formed a downward sloping triangle leading to the possibility of a breakout.
The Nikkei broke out of a triangle pattern in mid-November and powered its way up to almost 16400. Since then the lows have tested support, but have failed to convincingly break the 14000 level (with 13874 proving to be the key support level) and the return highs have been descending quite steadily forming another triangle; this time, downward sloping. The bearish trendline on the top has not acted as firm support and formed a hard line - rather it has acted as a dynamic resistance zone, leading to potential false breakouts.
#NKDM4, D1

Source: Blackwell Trader
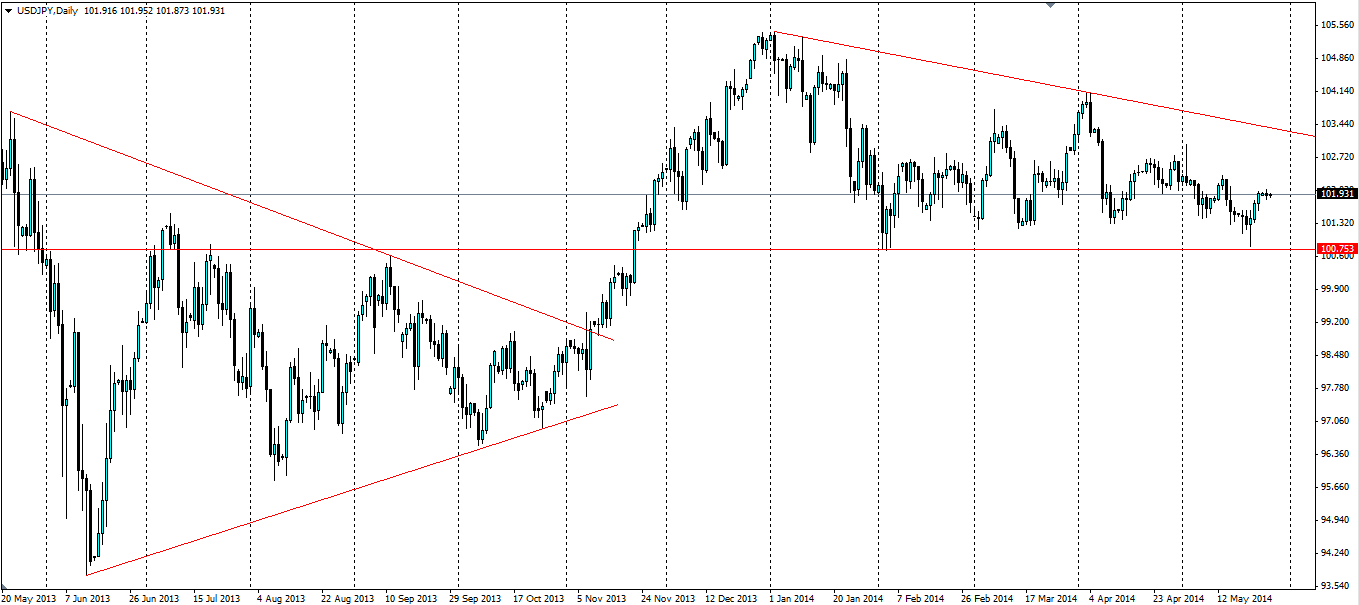
In the past, the movements of the USD/JPY pair have had an 80% correlation with the movements in the Nikkei 225. It is up for debate as to whom leads whom, but it is clear that the monetary policy of both Japan and the US have an effect on the Nikkei 225. So the talk of any rate increase in the US will send the US dollar up and weaken the yen, which in turn will boost the Nikkei as Japanese stocks become cheaper relative to US stocks because of the weakened Yen.
Alternatively, the stimulus packages of the Bank of Japan lead to a direct cash inflow into the Nikkei 225 pushing the level up. This in turn weakened demand for the yen as traders saw Japanese stocks as overvalued, so less cash was flowing into Japan. Hot off the press is a report that the Bank of Japan is looking at possible ways to exit the quantitative easing strategy that was put in place 13 months ago. Reuters reports that the talks are informal and there is a strong sense within the bank that the stimulus package is having its desired effect. We are still a long way off from any action, but these are positive steps from the BoJ and a sign they believe everything they have done is correct.
USD/JPY, D1

Source: Blackwell Trader
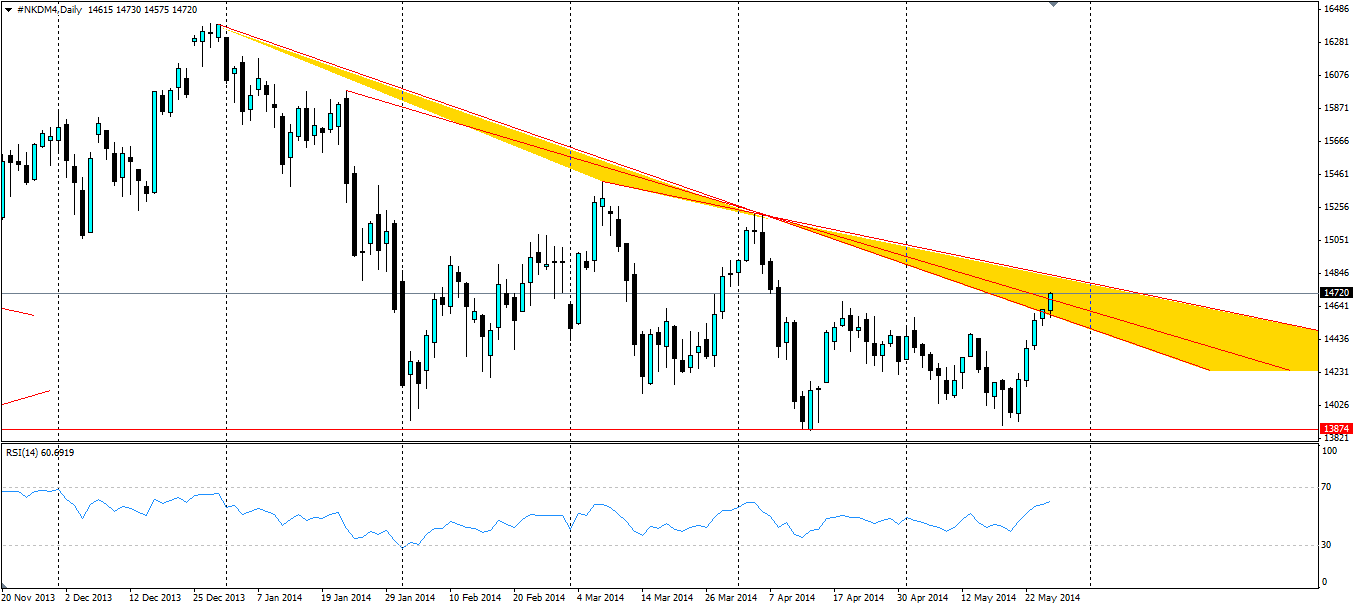
One thing is clear however; when the Nikkei 225 breaks out of the shape, the movement is likely to be very large indeed. The previous breakout resulted in a 1700 pip movement and the base of the current triangle is 2530 pips wide. There are a couple of trade setups we can put in place to take advantage of either a breakout of the current shape, or a movement back down to support at the 14000 level. The current candle looks to be forming a breakout, but we want to be patient and wait for a bullish candle as confirmation a genuine breakout is in place.
The current RSI level of 60.35 on the daily chart is certainly not in the region of “over-bought” but it could potentially be the beginnings of a breakout. The last two times the RSI reached these levels, it pulled back, so we will need to see it close to the 70 level if there is a breakout.

Source: Blackwell Trader
For the pullback strategy, we could set up below the previous day's candle to catch any movement back down. An entry around the 14500 mark would be appropriate with a stop loss outside the shape around 14750. A target for this play would be the bottom support level around the 14000-14050 region.
For the breakout strategy, the entry should be set well outside the shape and only once a bullish confirmation candle has closed above the line. A stop loss should be set back inside the shape to minimise losses in case the breakout is a false signal. A target for this movement can be set quite high as the movement should be rather large. A target at the previous top of 16390 would not be out of the realms of possibility, but the price may get stuck at some resistance levels on the way.
