🚀 AI-picked stocks soar in May. PRFT is +55%—in just 16 days! Don’t miss June’s top picks.Unlock full list

Nice Short On Proctor And Gamble

Published 01/25/2021, 01:27 PM
Updated 07/09/2023, 06:31 AM
PG
-

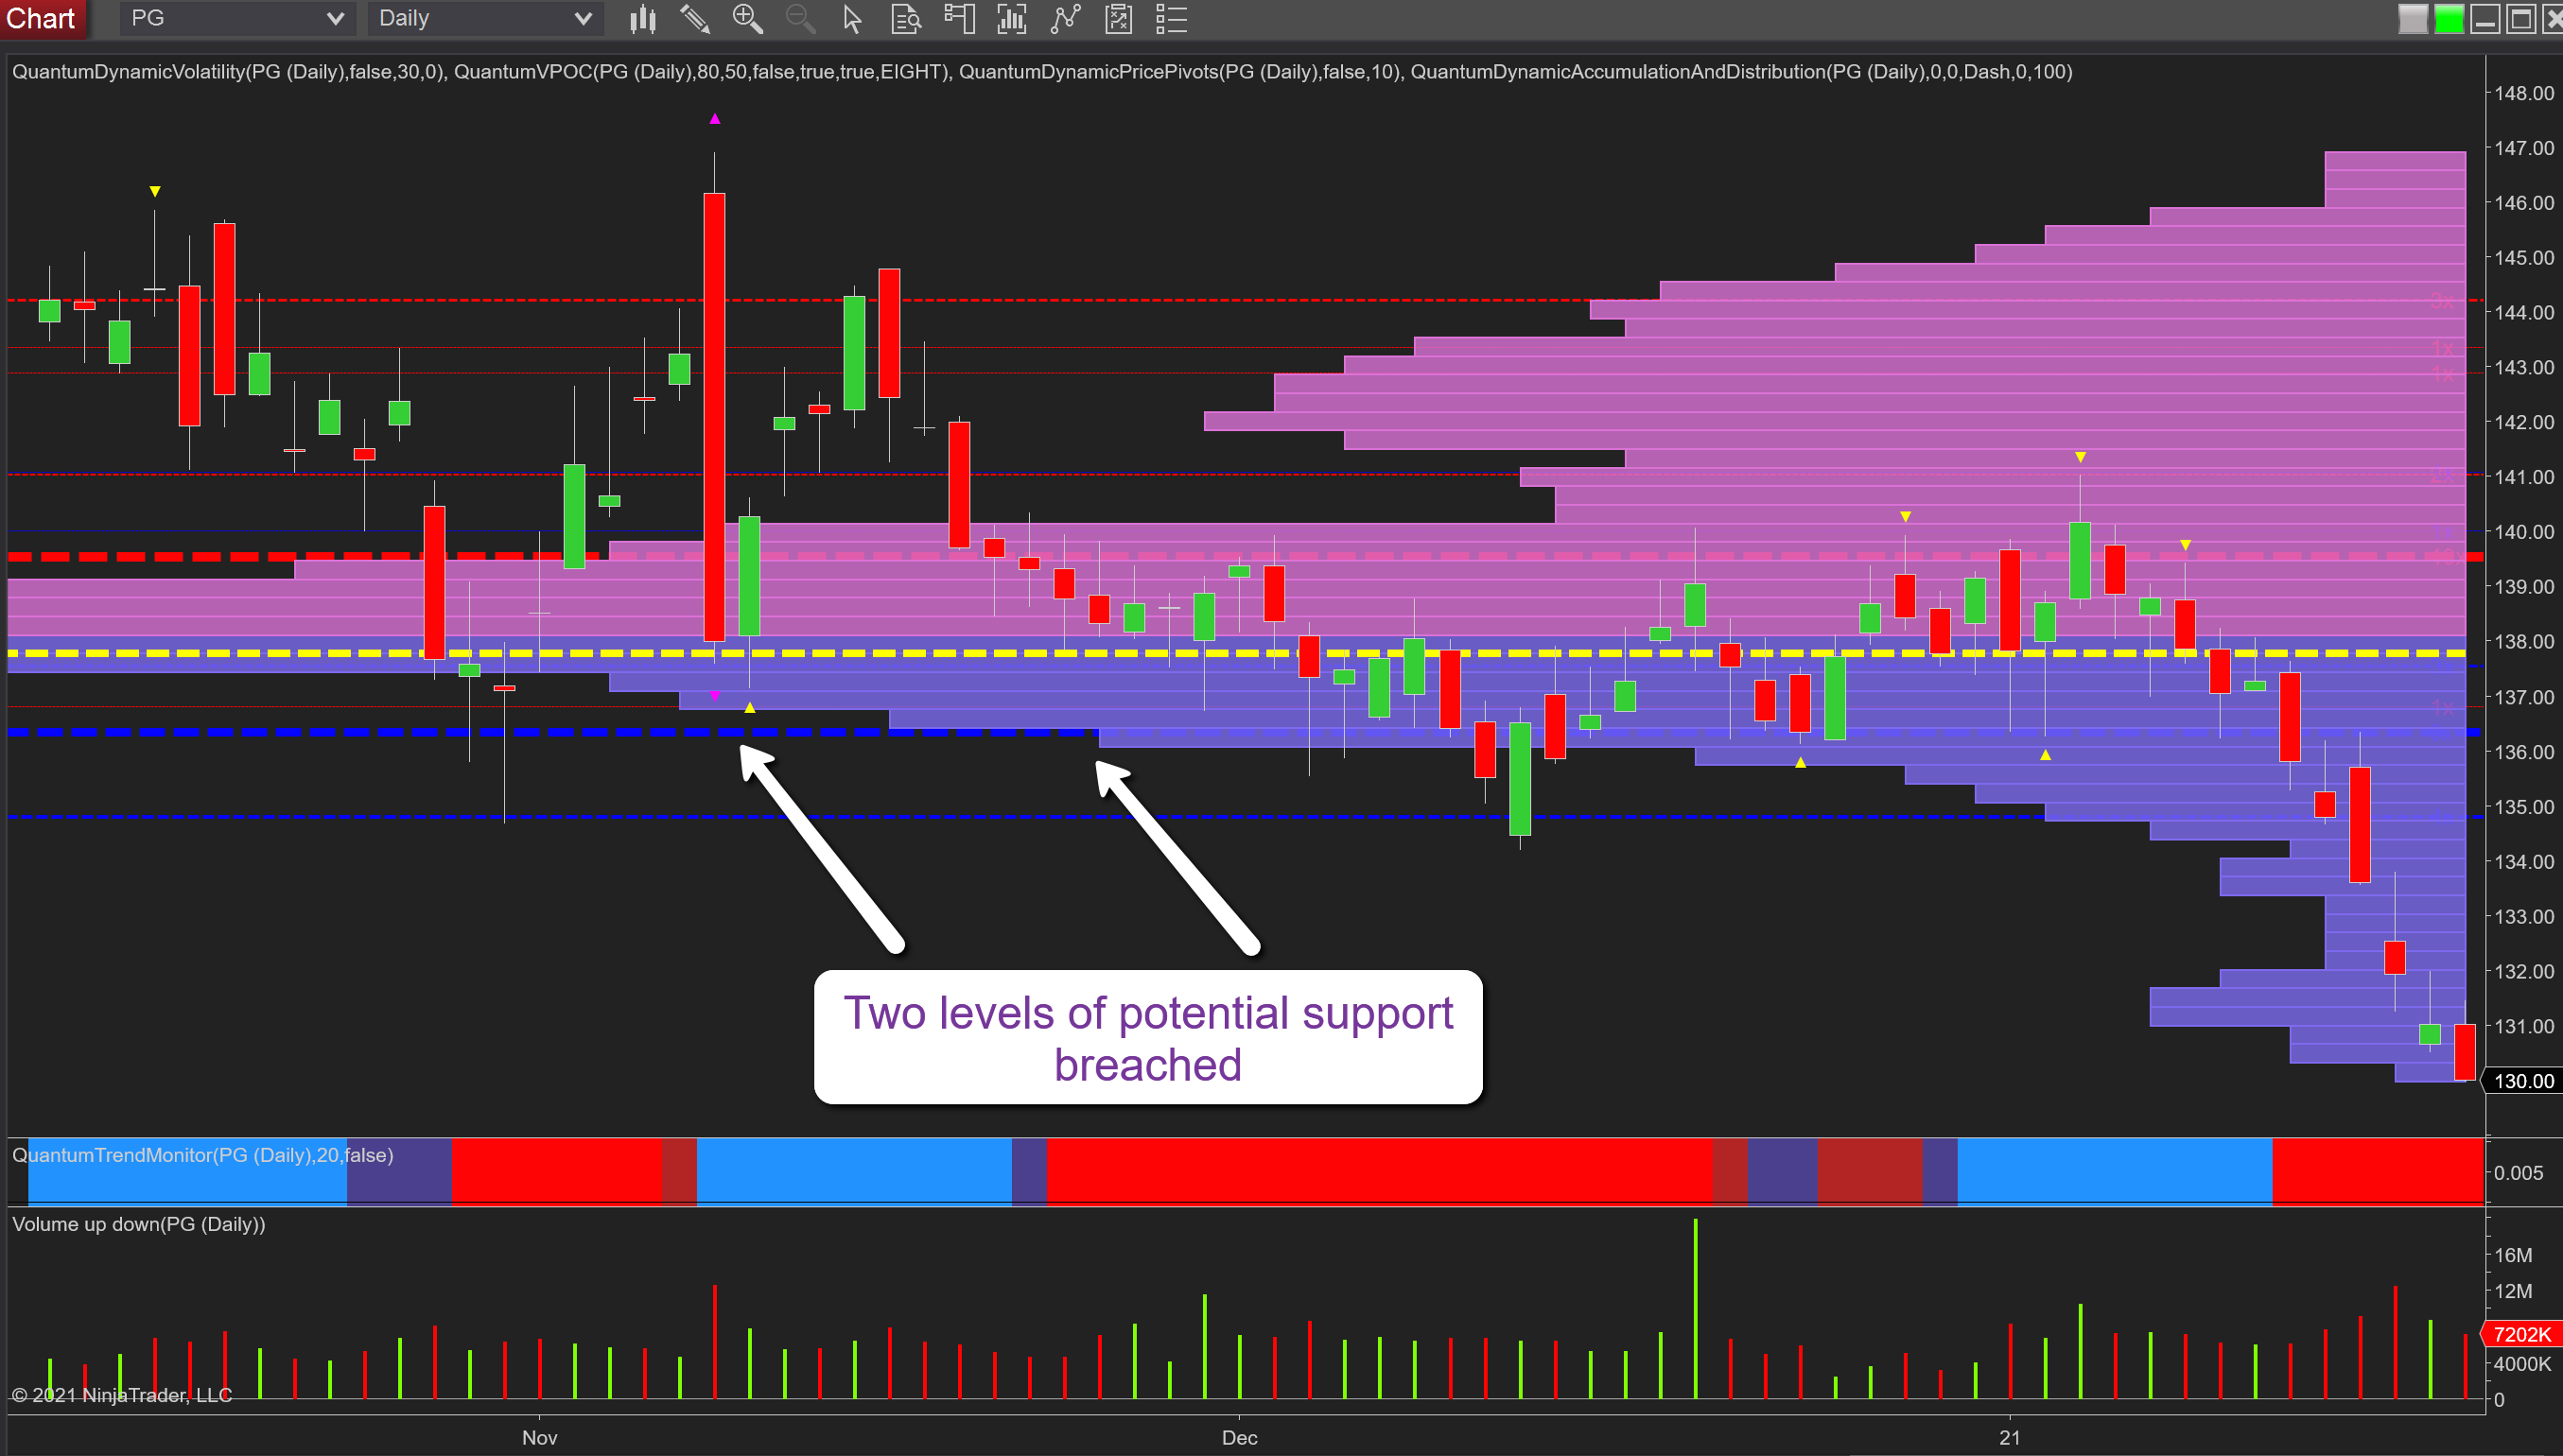
Proctor & Gamble Daily Chart.

Procter & Gamble (NYSE:PG) is a stock I have had my eye on for some time, and last week was when the price action developed, as expected. It is reaking away from the VPOC (volume point of control) with several classic signals to confirm this weakness.

However, the key to last week’s move should be seen in the context of the repeated attempts to rally and, in particular, the injection of volume in the middle of December. Moreover, the strong level of resistance in the $139.80 per share area was helping to cap advances in this stock. Then comes the breakdown in January with the potential platforms of support in the $136.40 area and lower at $134.90 both breached, the second being the more significant in terms of the development of the bearish trend. The move lower was also accompanied by rising volume on the daily chart. Note how the candles are shaped with deep wicks to the upper body, classic signs the waterfall is strengthening as each attempt to rise is overcome with selling.
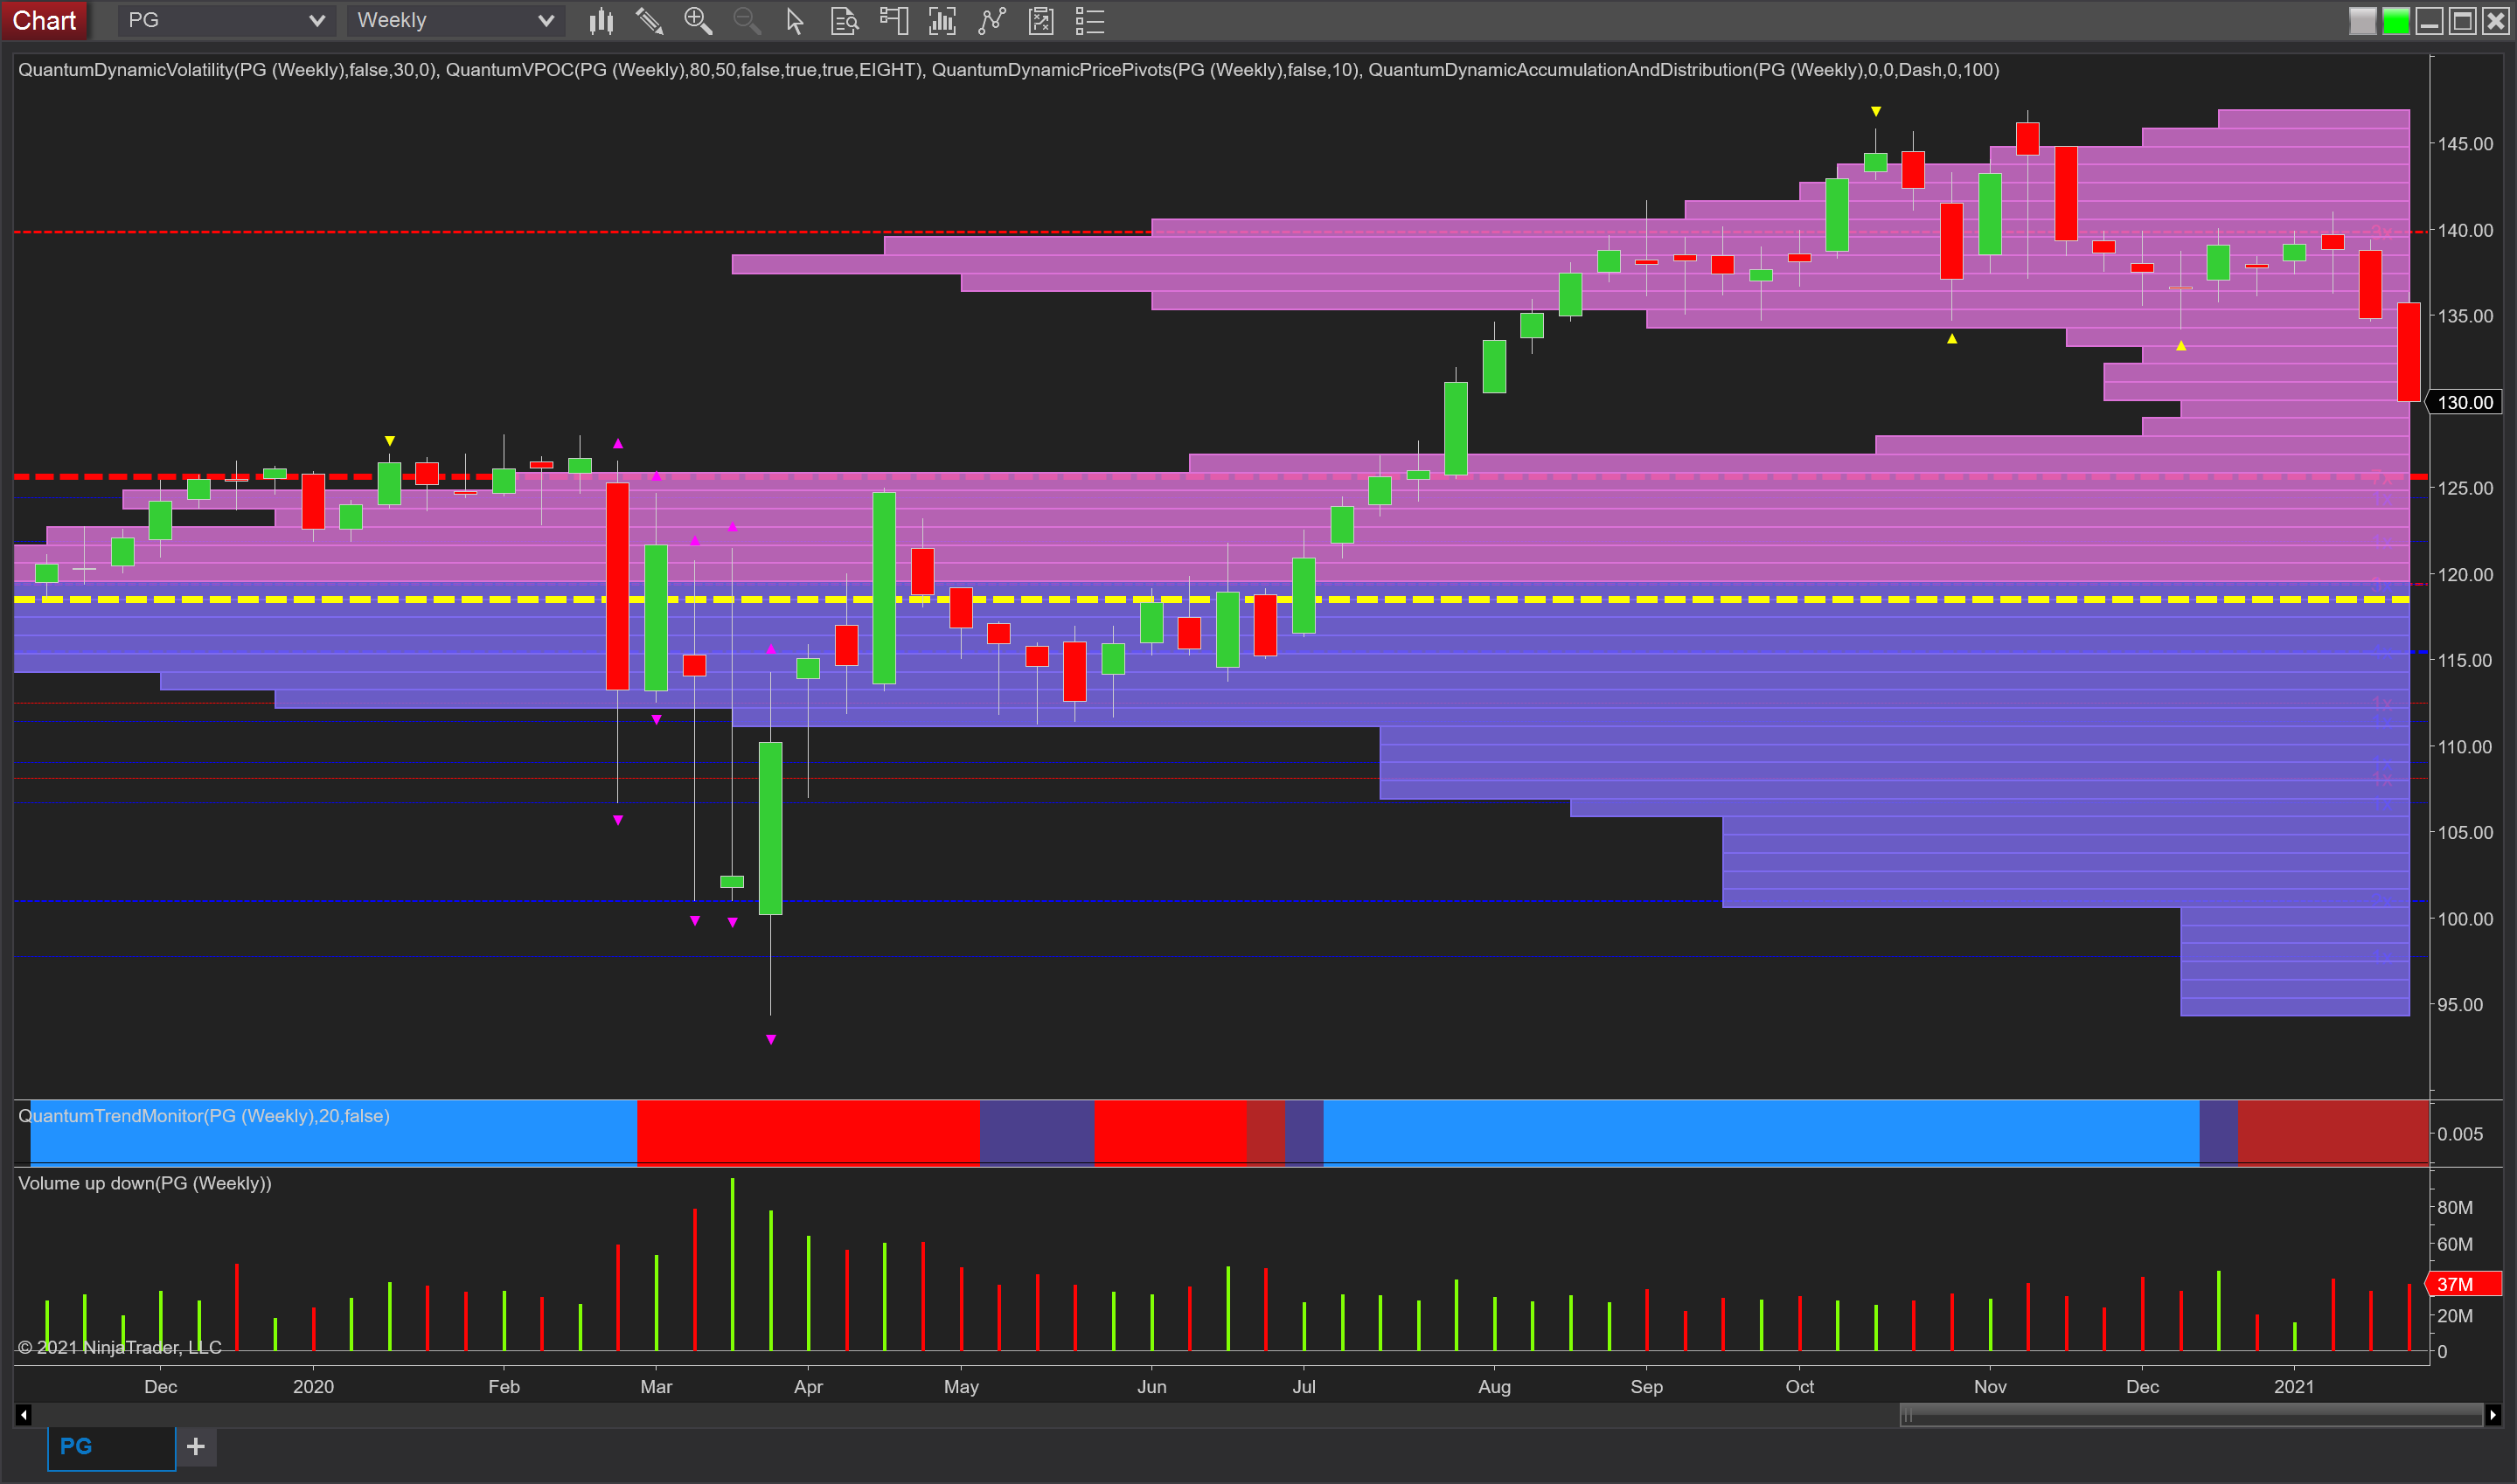
Proctor & Gamble Weekly Chart.

Moving to the weekly chart: Here we get some idea of where this move is likely to pause. With a low volume node on the VPOC histogram unlikely to offer any immediate respite to the current bearish trend, the next logical pause point is the reasonably strong price-based support in the $125-per-share area and denoted with the red dashed line of the accumulation and distribution indicator would be favourite. However, if this is breached, a move to the VPOC itself at $119 comes into play. Note, too, the trend monitor is also in transition.

Latest comments

Loading next article…
Risk Disclosure: Trading in financial instruments and/or cryptocurrencies involves high risks including the risk of losing some, or all, of your investment amount, and may not be suitable for all investors. Prices of cryptocurrencies are extremely volatile and may be affected by external factors such as financial, regulatory or political events. Trading on margin increases the financial risks.
Before deciding to trade in financial instrument or cryptocurrencies you should be fully informed of the risks and costs associated with trading the financial markets, carefully consider your investment objectives, level of experience, and risk appetite, and seek professional advice where needed.
Fusion Media would like to remind you that the data contained in this website is not necessarily real-time nor accurate. The data and prices on the website are not necessarily provided by any market or exchange, but may be provided by market makers, and so prices may not be accurate and may differ from the actual price at any given market, meaning prices are indicative and not appropriate for trading purposes. Fusion Media and any provider of the data contained in this website will not accept liability for any loss or damage as a result of your trading, or your reliance on the information contained within this website.
It is prohibited to use, store, reproduce, display, modify, transmit or distribute the data contained in this website without the explicit prior written permission of Fusion Media and/or the data provider. All intellectual property rights are reserved by the providers and/or the exchange providing the data contained in this website.
Fusion Media may be compensated by the advertisers that appear on the website, based on your interaction with the advertisements or advertisers.
© 2007-2024 - Fusion Media Limited. All Rights Reserved.