
This is a quick note on some very suspicious order flow in NXY before the takeover news, announced today. First, the news:
Cnooc: China’s Cnooc unveiled what would be Beijing’s biggest deal yet for energy resources abroad, with a $15.1 billion pact to acquire Canada’s Nexen.
Source: WSJ
Let's get right into the suspicious trading. First, I've included a small snippet from the Stats Tab, below, to establish the "average."
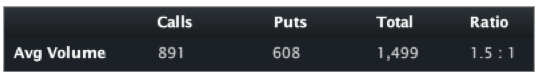
We can see that the average daily option volume is ~1,500 contracts a day. Note that if I take out the three days that I'll be discussing, that average is actually just 387 contracts a day.
On Friday (the last trading day before today), some enormous volume came into the Dec. options.
I've included the Options Tab from Friday along with the largest trades of the day, below.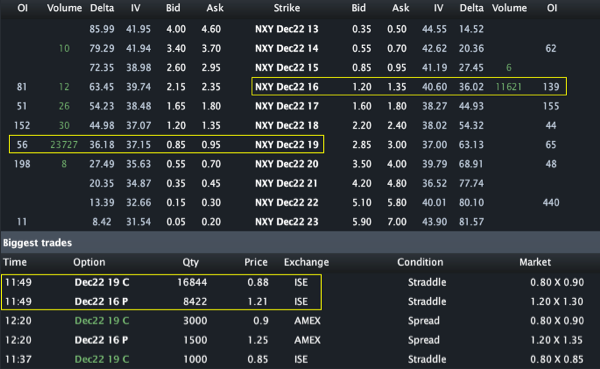
Specifically we can see that ~20,000 Dec. 19 calls were purchased and funded by a sale of ~10,000 Dec. 16 puts. The total cost of the 20,000 x 10,000 was ~:
20,000*$0.88*100 - 10,000*$1.21*100 = $550,000 (or $0.55 for 10,000 2x1 risk reversals).
I've included the the Options Tab from today, below.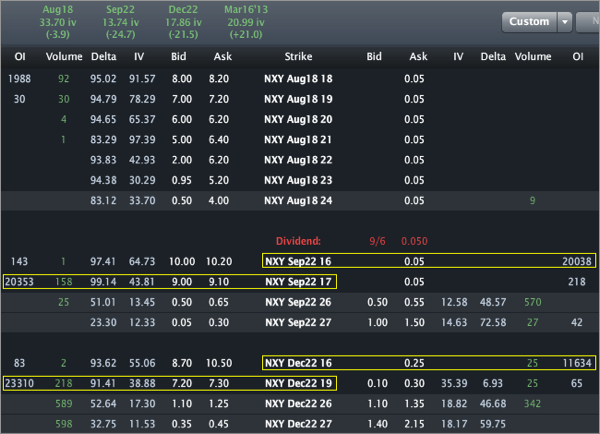
Those puts sold are now worthless and the calls are worth ~$7.30. In total, that position is now worth $14.5 million for a $14 million win (2,800%) in one trading day.
Honestly, that's really enough to complete the article, but there's actually more. A lot more.
On 7-16-2012 and 7-17-2012, 20,000 more risk reversals traded in Sep. I've included the Options Tabs from those two days, respectively.
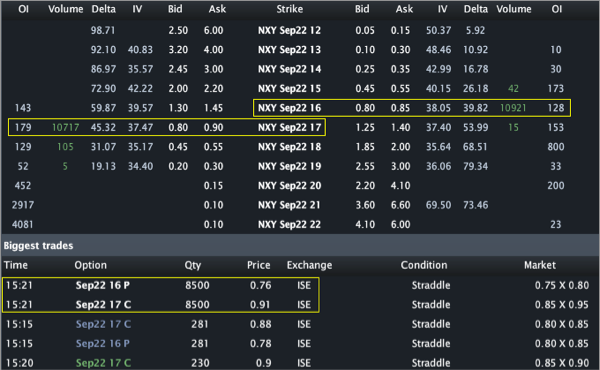
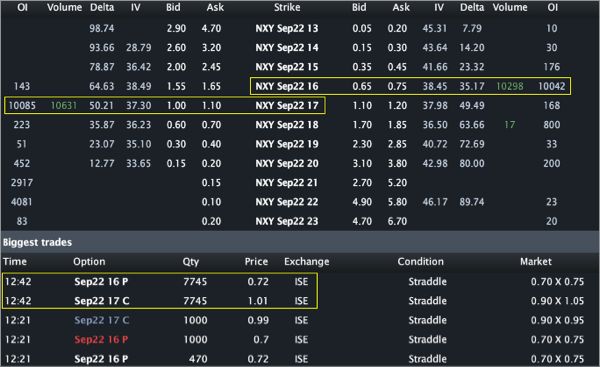
We can see the Sep. 16/17 risk reversal (selling puts to buy calls) ~20,000 for an average price of ~$0.15 or a $450,000 outlay. Looking back to the Options Tab for today (above), that position is now worth $18 million for a $17.55 million win or 3,900% in a week.
In total on those three days, 70,000 contracts traded representing 6,000% of daily option volume and profited more than $32 million on an outlay of $1 million. I also note that on two of those three days (7-16 and 7-20), the stock volume was right around the average, so it doesn't look like the options trades were tied to stock.
This is probably the most compelling/suspicious order flow I have seen in a takeover in several years. In fact, it's so suspicious and so large that it poses the only real doubt I have that perhaps something else was at play. If the trades were done at 1/10 the size, so $100k turned a $2.5 million profit, I would be screaming bloody murder, but this is so big I almost doubt my suspicion...
I said almost...
Disclosure: This is trade analysis, not a recommendation.
- English (UK)
- English (India)
- English (Canada)
- English (Australia)
- English (South Africa)
- English (Philippines)
- English (Nigeria)
- Deutsch
- Español (España)
- Español (México)
- Français
- Italiano
- Nederlands
- Português (Portugal)
- Polski
- Português (Brasil)
- Русский
- Türkçe
- العربية
- Ελληνικά
- Svenska
- Suomi
- עברית
- 日本語
- 한국어
- 简体中文
- 繁體中文
- Bahasa Indonesia
- Bahasa Melayu
- ไทย
- Tiếng Việt
- हिंदी
Nexen Order Flow Looks Suspect
Published 07/23/2012, 03:47 PM
Updated 07/09/2023, 06:31 AM
Nexen Order Flow Looks Suspect
3rd party Ad. Not an offer or recommendation by Investing.com. See disclosure here or
remove ads
.
Latest comments
Install Our App
Risk Disclosure: Trading in financial instruments and/or cryptocurrencies involves high risks including the risk of losing some, or all, of your investment amount, and may not be suitable for all investors. Prices of cryptocurrencies are extremely volatile and may be affected by external factors such as financial, regulatory or political events. Trading on margin increases the financial risks.
Before deciding to trade in financial instrument or cryptocurrencies you should be fully informed of the risks and costs associated with trading the financial markets, carefully consider your investment objectives, level of experience, and risk appetite, and seek professional advice where needed.
Fusion Media would like to remind you that the data contained in this website is not necessarily real-time nor accurate. The data and prices on the website are not necessarily provided by any market or exchange, but may be provided by market makers, and so prices may not be accurate and may differ from the actual price at any given market, meaning prices are indicative and not appropriate for trading purposes. Fusion Media and any provider of the data contained in this website will not accept liability for any loss or damage as a result of your trading, or your reliance on the information contained within this website.
It is prohibited to use, store, reproduce, display, modify, transmit or distribute the data contained in this website without the explicit prior written permission of Fusion Media and/or the data provider. All intellectual property rights are reserved by the providers and/or the exchange providing the data contained in this website.
Fusion Media may be compensated by the advertisers that appear on the website, based on your interaction with the advertisements or advertisers.
© 2007-2024 - Fusion Media Limited. All Rights Reserved.