
Newmont Goldcorp Corporation (NYSE:NEM) reported net income from continuing operations of $2,226 million or $2.71 per share in third-quarter 2019, against net loss of $161 million or 31 cents in the year-ago quarter. The results were driven by gains from the formation of Nevada Gold Mines as well as higher realized gold prices and production.
Barring one-time items, adjusted earnings were 36 cents per share. However, the figure trailed the Zacks Consensus Estimate of 40 cents.
Newmont Goldcorp delivered revenues of $2,713 million, up around 57.2% year over year. However, the figure missed the Zacks Consensus Estimate of $3,016.9 million.
Newmont Goldcorp Corporation Price, Consensus and EPS Surprise
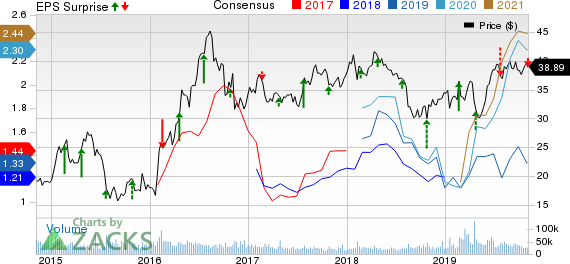
Newmont Goldcorp Corporation price-consensus-eps-surprise-chart | Newmont Goldcorp Corporation Quote
Operational Highlights
Newmont Goldcorp's attributable gold production rose around 28% year over year to 1.64 million ounces in the third quarter.
The company’s costs applicable to sales (CAS) for gold was $733 per ounce, up 6.1% year over year.
All-in sustaining costs (AISC) for gold rose nearly 10% year over year to $987 per ounce mainly due to higher gold CAS per ounce and higher sustaining capital spending.
Regional Performance
North America
Attributable gold production in North America was 325,000 ounces, up roughly 296% year over year. Gold CAS for the region was $945 per ounce, up around 15% year over year.
South America
Attributable gold production in South America was 275,000 ounces, up 54% year over year. Gold CAS for the region rose around 5% to $669 per ounce.
Australia
Attributable gold in the region was 339,000 ounces, down around 12% year over year. Gold CAS in this region rose 11% year over year to $768 per ounce.
Africa
Production in the region totaled 267,000 ounces of gold in the quarter, up 26% year over year. Gold CAS was $563 per ounce, up 11% year over year.
Financial Position
The company ended the third quarter with $2.7 billion of consolidated cash. Net debt was around $4.8 billion, up from nearly $1.1 billion in the year-ago quarter.
Net cash from operating activities surged 86.1% year over year to $791 million in the quarter.
Outlook
Newmont Goldcorp revised its outlook for 2019. The company now expects attributable gold production for 2019 to be 6.3 million ounces, down from 6.5 million ounces projected earlier.
For 2019, all-in sustaining costs for gold are projected to be $965 per ounce, down from previous expectation of $975. Costs applicable to sales expectation for gold are $715 per ounce compared with $735 expected earlier.
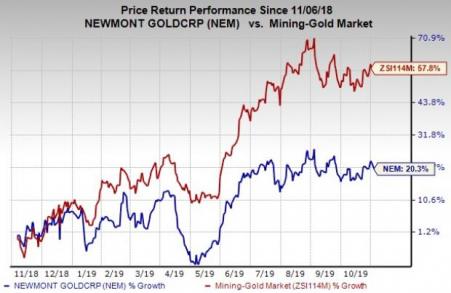
Price Performance
Newmont Goldcorp’s shares have gained 20.3% in the past year compared with 57.8% surge of the industry.
Zacks Rank & Stocks to Consider
Newmont Goldcorp currently carries a Zacks Rank #3 (Hold).
Some better-ranked stocks in the basic materials space are Kinross Gold Corporation (NYSE:KGC) , Franco-Nevada Corporation (TSX:FNV) and Agnico Eagle Mines Limited (NYSE:AEM) , each sporting a Zacks Rank #1 (Strong Buy). You can see the complete list of today’s Zacks #1 Rank stocks here.
Kinross has an expected earnings growth rate of 210% for 2019. The company’s shares have surged 77.1% in the past year.
Franco-Nevada has a projected earnings growth rate of 39.3% for 2019. The company’s shares have rallied 47.6% in a year.
Agnico Eagle has an estimated earnings growth rate of 168.6% for the current year. Its shares have moved up 65.7% in the past year.
More Stock News: This Is Bigger than the iPhone!
It could become the mother of all technological revolutions. Apple (NASDAQ:AAPL) sold a mere 1 billion iPhones in 10 years but a new breakthrough is expected to generate more than 27 billion devices in just 3 years, creating a $1.7 trillion market.
Zacks has just released a Special Report that spotlights this fast-emerging phenomenon and 6 tickers for taking advantage of it. If you don't buy now, you may kick yourself in 2020.
Click here for the 6 trades >>
Agnico Eagle Mines Limited (AEM): Free Stock Analysis Report
Newmont Mining Corporation (NEM): Free Stock Analysis Report
Kinross Gold Corporation (KGC): Free Stock Analysis Report
Franco-Nevada Corporation (FNV): Free Stock Analysis Report
Original post
Zacks Investment Research