
Newell Brands Inc. (NYSE:NWL) , once an investors’ favorite, has lost its shine following dismal third-quarter 2017 results and lowered its outlook for the year. Also, it has been witnessing strained margins for a while now. In fact, the Zacks Consensus Estimate moved south as the analysts were disappointed on the stock.
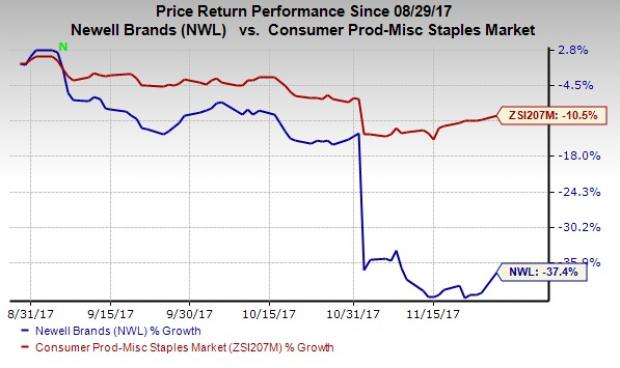
Shares of this Zacks Rank #5 (Strong Sell) company have declined 27.3% following its third-quarter results on Nov 2. In the past three months, the stock has plunged 37.4%, significantly wider than the industry’s decline of 10.5%. The downturn was due to the after-effects of Hurricane Harvey that resulted in increased inflationary pressure owing to low resins’ supply. Further, a Growth Score of F confirms the weakness in the stock.
Deeper Analysis
Q3 & Negative Estimate Revisions
The Zacks Consensus Estimate for the fourth quarter and 2017 has declined to 75 cents and $2.81, respectively, over the past 30 days. This follows Newell Brands’ dismal performance in the third quarter, which marked its first earnings miss in more than three years. Also, sales lagged estimates after two straight beats.
Results were below the company’s expectations and were hurt by soft late-quarter sales with respect to retailer inventory rebalancing, mainly related to the decelerated market growth, in the United States through the Back-to-School period. As a result, markets were weak across various categories. Though its bottom line improved 10.3% year over year, management slashed its outlook for 2017, marking the second guidance cut in three months. (Read: Newell Misses Q3 Earnings & Sales, Lowers '17 Outlook)
Newell Brands now expects normalized earnings per share in the range of $2.80-$2.85, down from $2.95-$3.05, projected earlier. Also, in September, the company had trimmed its earnings guidance for 2017 on increased inflationary pressure due to low resins’ supply owing to impacts from the Harvey.
Other Concerns
Newell Brands has been witnessing weak margins for the last few quarters now. Despite gains from cost synergies and Project Renewal savings, the absence of earnings related to divested businesses, commodity cost inflation, adverse product mix and increased advertising, promotion and e-commerce investment weighed on margins in the third quarter.
Apparently, the company’s gross margin contracted 100 basis points (bps) in the third quarter, while operating margin declined 40 bps. In the first and second quarters of 2017, Newell’s gross margin had declined 410 bps and 20 bps, respectively. While operating margin soared in the preceding quarter, it recorded a 250 bps decline in the first quarter.
Additionally, Newell Brands faces intense competition from numerous manufacturers and distributors of consumer and commercial products. This might dent the company’s operating performance and overall profitability.
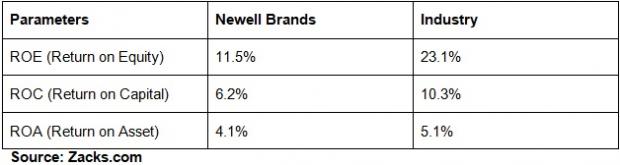
Newell Brands Vs Industry
Bottom Line
Though Newell Brands is on track to attain its transformation goals through market share gains, point of sale growth, innovation, e-commerce improvement and Project Renewal Program, the turnaround might take some time.
Meanwhile, you can count upon some better-ranked stocks in the broader Consumer Staples space that also witnessed positive estimate revisions recently.
The Boston Beer Company, Inc. (NYSE:SAM) consensus mark for 2017 and 2018 has moved up by 29 cents per share and 15 cents to $6.08 and $6.15, respectively, in the last 30 days. Also, this leading craft brewer sports a Zacks Rank #1 (Strong Buy). You can see the complete list of today’s Zacks #1 Rank stocks here.
The Estee Lauder Companies Inc. (NYSE:EL) has seen estimates for the second quarter and fiscal 2018 increase from $1.41 to $1.42 and $3.98 to $4.14, respectively in the past 30 days. This cosmetic giant also flaunts a Zacks Rank #1.
Vector Group Ltd. (NYSE:VGR) earnings estimates for the fourth quarter and 2017 have increased by a penny to 12 cents and 2 cents to 66 cents, respectively, in the past 30 days. The company holds a Zacks Rank #2 (Buy).
Today's Stocks from Zacks' Hottest Strategies
It's hard to believe, even for us at Zacks. But while the market gained +18.8% from 2016 - Q1 2017, our top stock-picking screens have returned +157.0%, +128.0%, +97.8%, +94.7%, and +90.2% respectively.
And this outperformance has not just been a recent phenomenon. Over the years it has been remarkably consistent. From 2000 - Q1 2017, the composite yearly average gain for these strategies has beaten the market more than 11X over. Maybe even more remarkable is the fact that we're willing to share their latest stocks with you without cost or obligation.
See Them Free>>
Newell Brands Inc. (NWL): Free Stock Analysis Report
Boston Beer Company, Inc. (The) (SAM): Free Stock Analysis Report
Estee Lauder Companies, Inc. (The) (EL): Free Stock Analysis Report
Vector Group Ltd. (VGR): Free Stock Analysis Report
Original post
Zacks Investment Research