🎁 💸 Warren Buffett's Top Picks Are Up +49.1%. Copy Them to Your Watchlist – For FreeCopy Portfolio

Nat Gas Sideways To Up, Resistance 395-400

Published 02/24/2014, 05:25 AM
Updated 05/14/2017, 06:45 AM


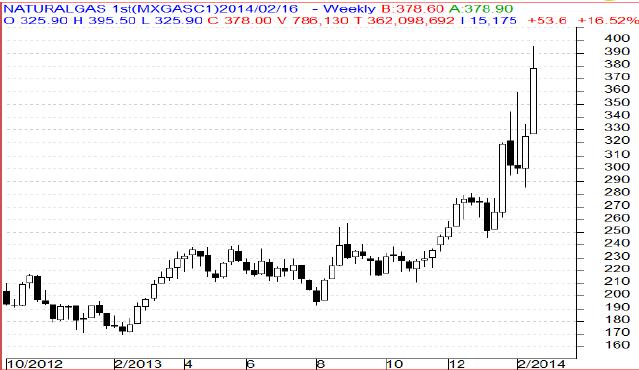
MCX Natural Gas February as seen in the weekly chart above has opened with the open = low formation at 325.90 and during this period prices rallied sharply higher breaking the resistance of 360 levels and made a high of 395.50. Finally prices closed sharply higher from the previous week closing levels.

For the next week we expect Natural Gas prices to find support in the range of 360 –355 levels. Trading consistently below 355 levels would lead towards the strong support at 325 levels and then finally towards the major support at 300 levels.

Resistance is now observed in the range of 395 - 400 levels. Trading consistently above 400 levels would lead towards the strong resistance at 440 levels, and then finally towards the Major resistance at 480 levels.

MCX / NYMEX Natural Gas Trading levels for the week

Trend: Sideways Up

S1- 355 / $ 5.650 R1-400 / $ 6.500
S2-325 / $ 5.000 R2-440 / $ 7.120

Weekly Recommendation: Buy MCX Natural Gas February between 355 - 360, SL- 325, Target – 400 / 410.

Latest comments

Loading next article…
Risk Disclosure: Trading in financial instruments and/or cryptocurrencies involves high risks including the risk of losing some, or all, of your investment amount, and may not be suitable for all investors. Prices of cryptocurrencies are extremely volatile and may be affected by external factors such as financial, regulatory or political events. Trading on margin increases the financial risks.
Before deciding to trade in financial instrument or cryptocurrencies you should be fully informed of the risks and costs associated with trading the financial markets, carefully consider your investment objectives, level of experience, and risk appetite, and seek professional advice where needed.
Fusion Media would like to remind you that the data contained in this website is not necessarily real-time nor accurate. The data and prices on the website are not necessarily provided by any market or exchange, but may be provided by market makers, and so prices may not be accurate and may differ from the actual price at any given market, meaning prices are indicative and not appropriate for trading purposes. Fusion Media and any provider of the data contained in this website will not accept liability for any loss or damage as a result of your trading, or your reliance on the information contained within this website.
It is prohibited to use, store, reproduce, display, modify, transmit or distribute the data contained in this website without the explicit prior written permission of Fusion Media and/or the data provider. All intellectual property rights are reserved by the providers and/or the exchange providing the data contained in this website.
Fusion Media may be compensated by the advertisers that appear on the website, based on your interaction with the advertisements or advertisers.
© 2007-2024 - Fusion Media Limited. All Rights Reserved.