I am a minimalist daytrader that doesn’t use all sorts of fancy technical indicators, complex patterns, or signals. I trade using simple price action with only two moving averages that are not even used that much. My best trades are made off a 5 minute chart. Sometimes, simple is best. Here is how I make a few easy trades per day with a high percentage of success:
Stocks to Trade
I keep things simple and trade liquid stocks between $10 – $70 with a minimum of 2 million shares traded daily. I often scan the top 10 or 20 list for volume leaders that day. Nothing special here and you can use whatever technique.
Charts to Use
Next I use one 5 minute chart per stock being tracked. I often watch 5-6 or so stocks at a time. This is a candle stick chart with nothing more than a 10 minute and 20 minute EMA.
First Hour Morning Trading
For my first hour I trade with a firm that feeds me high probability trades using a quant model. These are fast moving stocks where you typically make your largest gain in the first 15 – 30 minutes. You can contact me directly if you want some suggestions on trading this style and the firm I recommend. Basically you need wide stop-losses and guts of steel. You may get only a few trades a week and only one out of 5 might be great – but when it is good it is really good. Just make sure you don’t get shaken out too soon and know when the action is reversing. But I’m not going to focus on this right now.
Second Hour Morning Trading
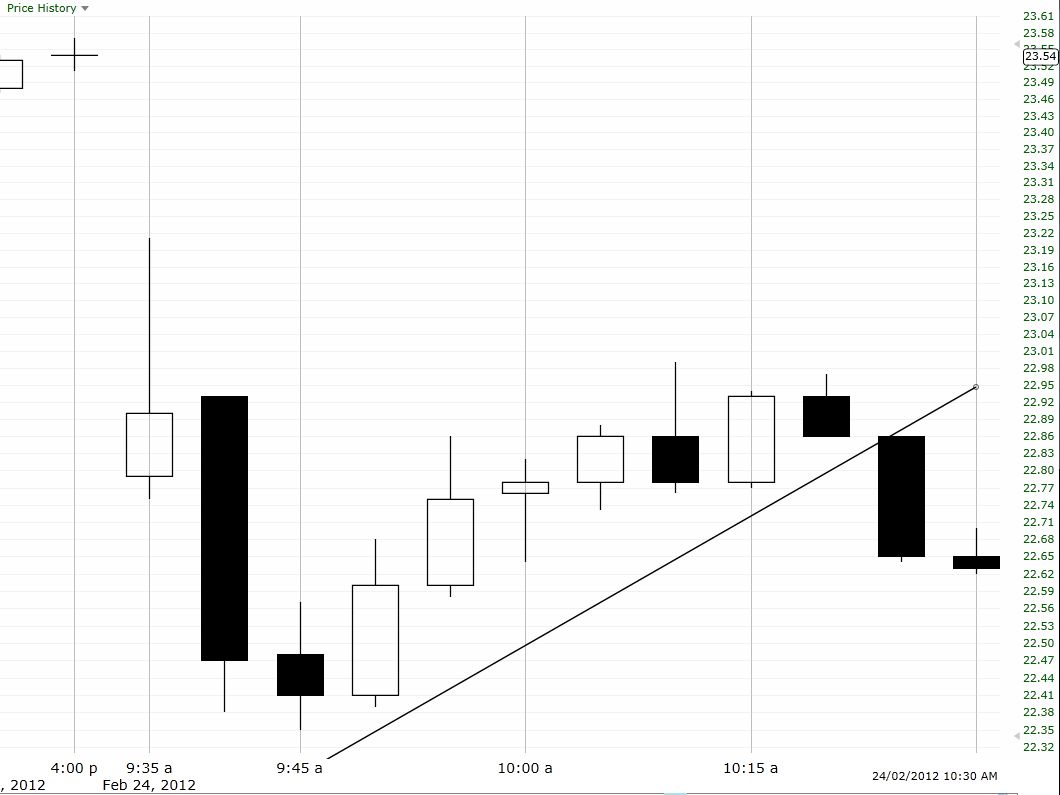
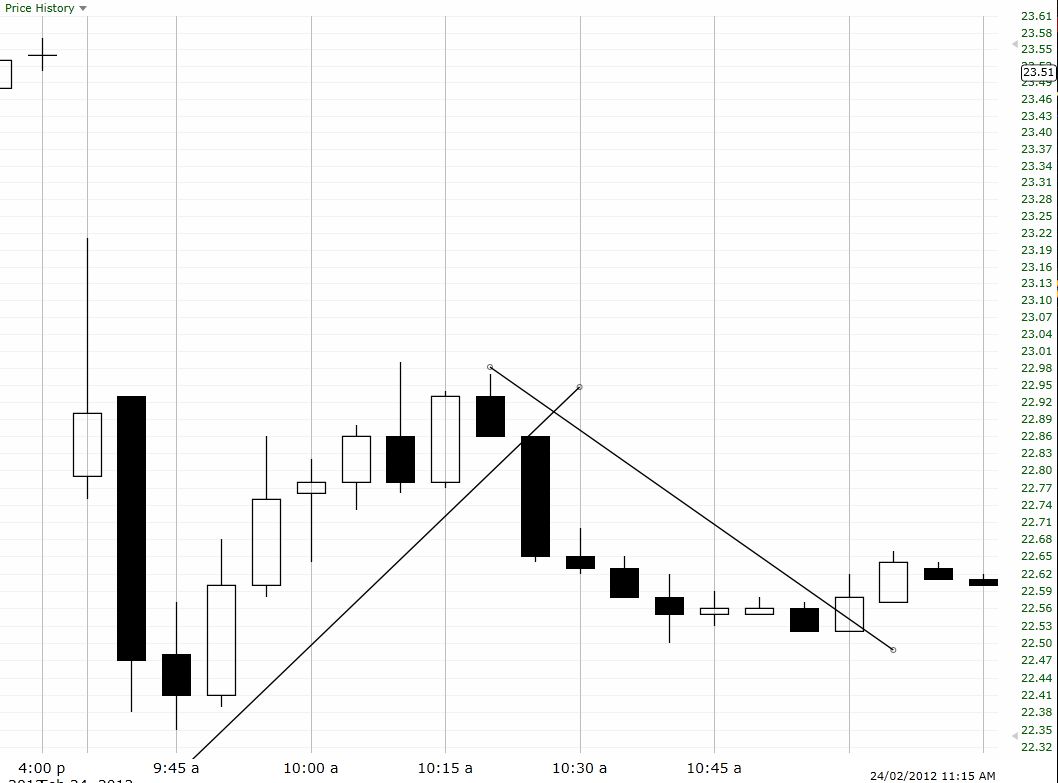
Starting in the 2nd hour I watch for trends that I can put a trendline on. Anything steeper than a 45% angle is met with a bit of skepticism (although the slope is a bit relative as your chart settings and even how much you zoom in will affect steepness of slope). Below is a stock I traded short in the morning as a pick from the firm. My short entry was $22.80 although the firm went short at $22.99. After 15 minutes I was out with a nice profit. At $22.40 I went long but that doesn’t really matter or apply here.
I watched the price action on the 5 minute chart as it rose while being careful not to draw a super steep trendline on prices. At 10:15 the candle let me put in a proper bottom. 10 minutes later that trend was broken. This is where you might reverse a trade. Keep in mind that a broken trend might simply mean a sideways trend followed by an up or down trend. You need to be on your A game and feel the trading in real-time to know how to react.
I generally follow the rule that I can only go short when the low of the previous bar is taken out. So my broken trendline and previous low both take place at $22.85 and the position will usually be a cent or two below this when remote prop trading from home. I draw a downward trendline while being aware not to make it too steep. This is still on a 5 minute chart.
As prices break up past my downward trendline and break above the high of the previous bar I try to exit at $22.58 but usually get filled a penny or two worse. A 23 – 25 cent move is a nice little gain and I walk away before the lunchtime lulls.
Review of My Simple Daytrading Rules
So the only rules I need for this simple setup is at least 30-45 minutes of trading on a 5 minute chart where I can draw a trend that is not too steep. Often I get a good bounce off my trendline within the first hour for a with-trend trade. But when the trend breaks down I bail at a minimum and consider reversing my position. If I trade short I need the previous bars low taken out. I cover when the downward trendline is broken and when the previous bars high is taken out. These are some simple trading rules I use.
Of course, I also use the 10 and 20 period EMA to show me possible stall and reversal zones but that along with support and resistance levels is for another post. If you want more information on which prop firms to trade with or which quant firms to get those wild morning trades from, feel free to contact me directly. I know my 5 minute daytrading setup is super simple but I find it works while keeping my mind clear to watch the urgency of the price trading action.
- English (UK)
- English (India)
- English (Canada)
- English (Australia)
- English (South Africa)
- English (Philippines)
- English (Nigeria)
- Deutsch
- Español (España)
- Español (México)
- Français
- Italiano
- Nederlands
- Português (Portugal)
- Polski
- Português (Brasil)
- Русский
- Türkçe
- العربية
- Ελληνικά
- Svenska
- Suomi
- עברית
- 日本語
- 한국어
- 简体中文
- 繁體中文
- Bahasa Indonesia
- Bahasa Melayu
- ไทย
- Tiếng Việt
- हिंदी
My Super-Simple, 5 Minute Day Trading Setup
Published 02/28/2012, 11:51 PM
Updated 07/09/2023, 06:31 AM
My Super-Simple, 5 Minute Day Trading Setup
3rd party Ad. Not an offer or recommendation by Investing.com. See disclosure here or
remove ads
.
Latest comments
This is hardly a complete description for a setup.
what about quantities? stops?
you enter trades based on trendline breaks? always? you take all signals?
what you're really saying is that you "wing" it. - that may work for you - congrats. but it can't work for anyone else. you're doing way more then you described (probably intuitively if you're successful).
I meant to write a series of posts but I ended up writing a short manual...which is no longer available - long story. There is much more than this. Use 1 minute 10 and 20 ema crossovers to form a bias, use 10 and 20 ema on 5 min chart for stall zones adn potential bounces, track the SPY for correlation, create a channel for short-term targets, etc. etcd.
What kind of annual returns have you accomplished through this method of trading?
Great to hear you.. Nice learning from your post.
Thanks,.
Thanks - much appreciated. You currently learning, trading retail, or prop trading with a firm?
Install Our App
Risk Disclosure: Trading in financial instruments and/or cryptocurrencies involves high risks including the risk of losing some, or all, of your investment amount, and may not be suitable for all investors. Prices of cryptocurrencies are extremely volatile and may be affected by external factors such as financial, regulatory or political events. Trading on margin increases the financial risks.
Before deciding to trade in financial instrument or cryptocurrencies you should be fully informed of the risks and costs associated with trading the financial markets, carefully consider your investment objectives, level of experience, and risk appetite, and seek professional advice where needed.
Fusion Media would like to remind you that the data contained in this website is not necessarily real-time nor accurate. The data and prices on the website are not necessarily provided by any market or exchange, but may be provided by market makers, and so prices may not be accurate and may differ from the actual price at any given market, meaning prices are indicative and not appropriate for trading purposes. Fusion Media and any provider of the data contained in this website will not accept liability for any loss or damage as a result of your trading, or your reliance on the information contained within this website.
It is prohibited to use, store, reproduce, display, modify, transmit or distribute the data contained in this website without the explicit prior written permission of Fusion Media and/or the data provider. All intellectual property rights are reserved by the providers and/or the exchange providing the data contained in this website.
Fusion Media may be compensated by the advertisers that appear on the website, based on your interaction with the advertisements or advertisers.
© 2007-2024 - Fusion Media Limited. All Rights Reserved.
