KEY DATA RELEASES TODAY (BST) :
10:00 EUR Retail Sales m/m -0.4% v -0.2%
13:15 USD ADP Non-Farm Employment Change 192K v 189K
13:30 USD Prelim Unit Labor Costs q/q 4.5% v 2.7%
13:30 USD Prelim Nonfarm Productivity q/q -1.8% v -1.8%
14:15 USD Fed Chair Yellen Speaks
15:30 USD Crude Oil Inventories 1.3M (NYSE:MMM) v 1.9M
18:30 USD FOMC Member Lockhart Speaks
OVERNIGHT:
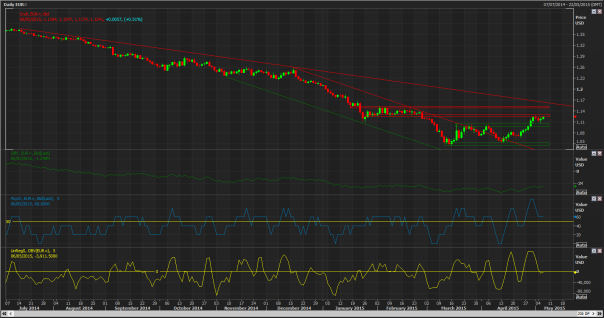
EUR/USD rallied to an overnight high 1.1243 on USD weakness and the European Commission’s upgrade Eurozone economic growth. The EU has nudged up its forecast for economic growth across the 19-country Eurozone except Greece. Seller are reported to have offers resting at 1.1260 just above the 100DM, the EUR has traded below the 100DMA for the last 12 months. Eurozone Retail sales and Services PMI released this morning.
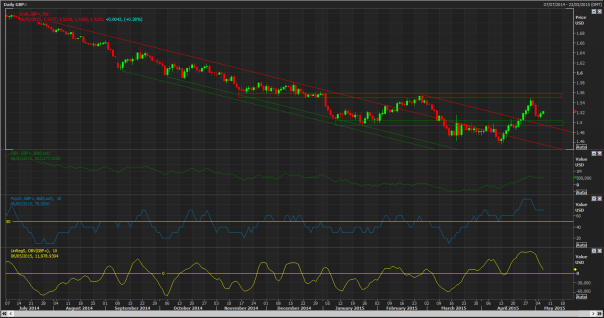
UK construction PMI fell sharply to 54.2 in April, as companies put off decisions before the UK General election, but confidence remained high and hinted at a post-election pick up GBP/USD slipped to 1.5087 low after the data but then bounced back above 1.5200 during US session amid the sell off in the USD.
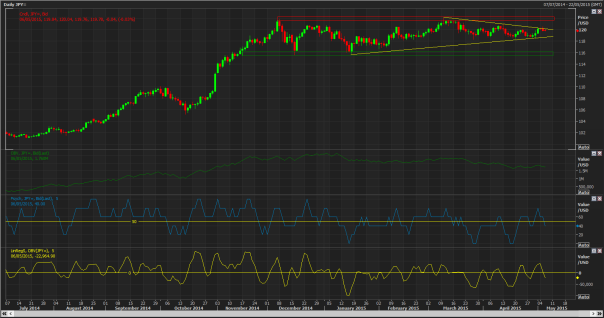
USD/JPY surged to a 3-week high of 120.51 in European session whereas disappointing US data sent the pair breaking below 120 handle overnight. Japan’s large exporters should pass on the benefits from the weaker yen to suppliers who are hurt by higher costs for imported raw materials, Deputy Economy Minister Nishimura said.
PRICE ACTION OVERVIEW:
EUR: While 1.1120/40 supports intraday expect retest and break of last weeks highs en-route to 1.1350
GBP: While 1.5050 supports the advance expect a retest and break of 1.55 en route to 1.5560
JPY: Rejected at the 120 descending trendline resistance offers a break and close above 120.50 opens April highs
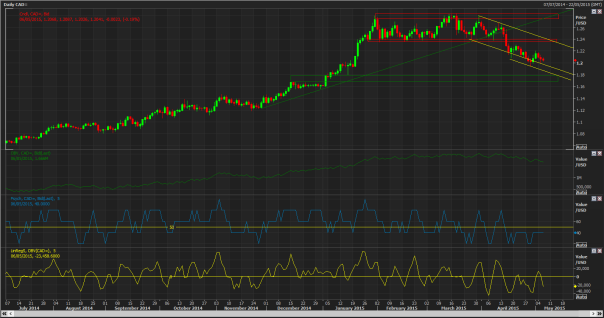
CAD: Bids at 120 continue to support on a closing basis, while this level survives anticipate a retest of 123/24 from below
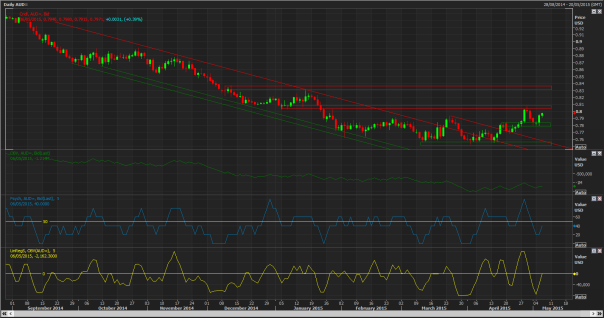
AUD: Offers at .8050 reject on the first attempt while .78 supports potential for another run at .8050
KEY TRADES:
| FX Pair | Short Term | Position/Date | Entry Level | Target | Stop | Comments |
| EUR/USD | Neutral | Await new signal | ||||
| GBP/USD | Neutral | Await new signal | ||||
| USD/JPY | Neutral | Long/30 Apr | 119.35 | OPEN | 119.35 | Intraday signal |
| USD/CAD | Neutral | Await new signal | ||||
| AUD/USD | Neutral | Await new signal |
ANALYSIS:
EUR/USD Short Term (1-3 Days): Neutral – Medium Term (1-3 Weeks) Bearish
- While 1.1120/40 supports intraday expect retest and break of last weeks highs en-route to 1.1350, only below 1.1050 concerns immediate bullish bias
- Order Flow indicators; OBV ticking back up, Linear Regression and Psychology retest midpoints from above
- Monitoring price action and Order Flow indicators to set shorts against 1.1350
GBP/USD: Short Term (1-3 Days): Neutral – Medium Term (1-3 Weeks) Bearish
- While 1.5050 supports the advance expect a retest and break of 1.55 en route to 1.5560. Below 1.5050 sees retest of 14990 base, failure here renews medium term down trend and retest of year to date lows.
- Order Flow indicators; OBV ticks back up, Linear Regression and Psychology bullish but rolling over to retest midpoints from above
- Monitoring price action and Order Flow for shorts targeting 1.45 initially and 1.42 in extension against 1.5560
USD/JPY: Short Term (1-3 Days): Neutral – Medium Term (1-3 Weeks) Bullish
- Rejected at the 120 descending trendline resistance offers a break and close above 120.50 opens April highs, failure suggests another retreat back to range lows.
- Order Flow indicators; OBV ticking up from recent lows, Linear Regression and Psychology pierce midpoints from above
- Monitoring price action and Order Flow indicators to set longs against 118 targeting 124
USD/CAD: Short Term (1-3 Days): Bearish – Medium Term (1-3 Weeks) Bullish
- Bids at 120 continue to support on a closing basis, while this level survives anticipate a retest of 123/24 from below. A break of 120 target 118 next
- Daily Order Flow indicators; OBV ticking back down, Linear Regression and Psychology attempt midpoint tests from below
- Monitoring price action and Order Flow indicators on retest of 123/124
AUD/USD: Short Term (1-3 Days): Neutral – Medium Term (1-3 Weeks) Bearish
- Offers at .8050 reject on the first attempt while .78 supports potential for another run at .8050, below .78 concerns near term bullish bias
- Order Flow indicators; OBV ticking up from recent low, Linear Regression and Psychology bearish but attempting midpoint tests from below
- Monitoring price action and Order Flow indicators to set shorts targeting .72 against .8050
