Get 40% Off
🚨 Volatile Markets? Find Hidden Gems for Serious Outperformance
Find Stocks Now

More To Come From Microsoft

Published 11/18/2019, 03:44 PM
Updated 07/09/2023, 06:31 AM
Microsoft

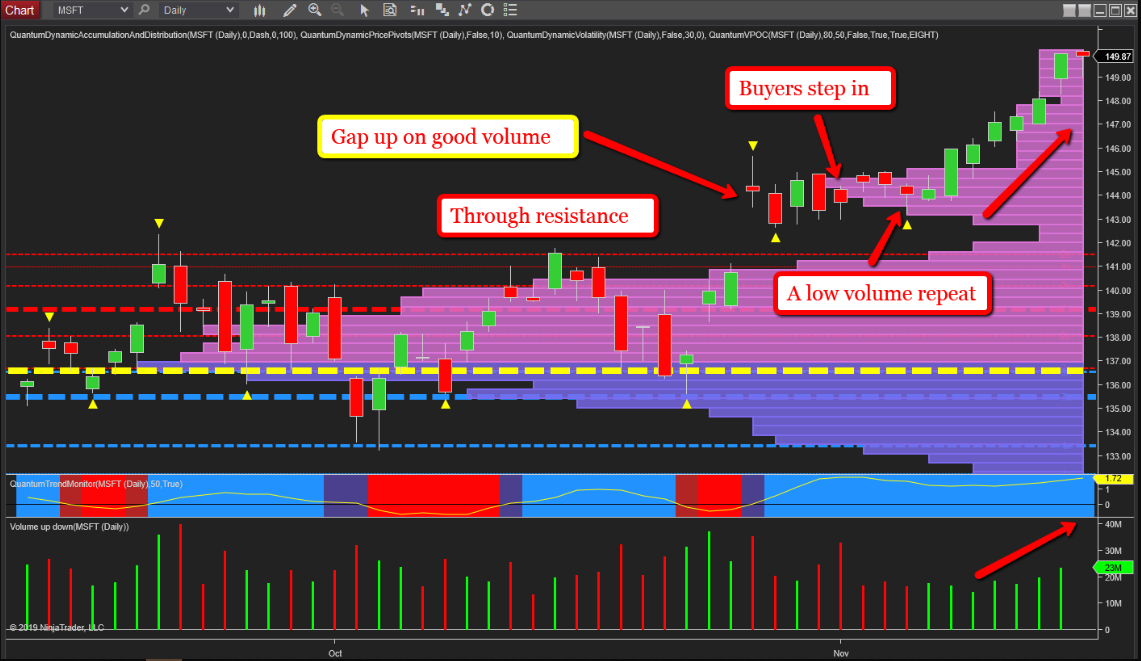
The daily chart for Microsoft (NASDAQ:MSFT) is one with many interesting aspects, all of which are helping to confirm the bullish sentiment for this stock, which is also benefitting from the strong uptrend now in place with the primary indices.

And while it is punctuated with gaps, the key one occurring toward the end of October when the stock opened gapped-up and well above the resistance, which had until then been building in the $141.50 per share area. This level is denoted with the red dashed line of the accumulation and distribution indicator, which prints these levels automatically and more importantly, their strength is defined by the width of the line. The volume associated with the breakout was high thereby confirming this as a genuine move and not a fake-trap move. This was further confirmed four days later with the narrow spread down candle and lower wick with identical volume confirming the break. The conclusion is simple and volume price analysis of 101. If it had been selling, the candle would be wide spread with no lower wick. It is not, and therefore an anomaly and signalling buying. This was confirmed three days later with a repeat candle, but this time on average volume. In other words, we are revisiting an area that had previously seen high volume and is now low. The conclusion again is simple. The selling pressure has now been absorbed and the market makers are ready to resume the move higher, which begins almost immediately. This is the concept of a low volume test.

Since then, we have seen the stock move steadily higher and note the volume. Rising price and rising volume, an excellent signal and therefore telling us there is more to come from Microsoft (NASDAQ:MSFT) in due course. Note the trend monitor indicator confirming the move and with a low volume node now ahead on the volume point of control histogram, it is an excellent technical picture for MSFT as the stock prepares for a solid move through the $150 price level.

3rd party Ad. Not an offer or recommendation by Investing.com. See disclosure here or remove ads .

Latest comments

Excellent article.
Risk Disclosure: Trading in financial instruments and/or cryptocurrencies involves high risks including the risk of losing some, or all, of your investment amount, and may not be suitable for all investors. Prices of cryptocurrencies are extremely volatile and may be affected by external factors such as financial, regulatory or political events. Trading on margin increases the financial risks.
Before deciding to trade in financial instrument or cryptocurrencies you should be fully informed of the risks and costs associated with trading the financial markets, carefully consider your investment objectives, level of experience, and risk appetite, and seek professional advice where needed.
Fusion Media would like to remind you that the data contained in this website is not necessarily real-time nor accurate. The data and prices on the website are not necessarily provided by any market or exchange, but may be provided by market makers, and so prices may not be accurate and may differ from the actual price at any given market, meaning prices are indicative and not appropriate for trading purposes. Fusion Media and any provider of the data contained in this website will not accept liability for any loss or damage as a result of your trading, or your reliance on the information contained within this website.
It is prohibited to use, store, reproduce, display, modify, transmit or distribute the data contained in this website without the explicit prior written permission of Fusion Media and/or the data provider. All intellectual property rights are reserved by the providers and/or the exchange providing the data contained in this website.
Fusion Media may be compensated by the advertisers that appear on the website, based on your interaction with the advertisements or advertisers.
© 2007-2024 - Fusion Media Limited. All Rights Reserved.