Further to my last weekly market update, this week's update will look, firstly, at the six Major Indices and nine Major Sectors, as shown on the two Daily line chartgrids below, then two Daily SPX:VIX and RUT:RVX ratio charts, and, finally, Major World Indices, Commodities, and Currencies, as shown on the subsequent Daily chartgrids.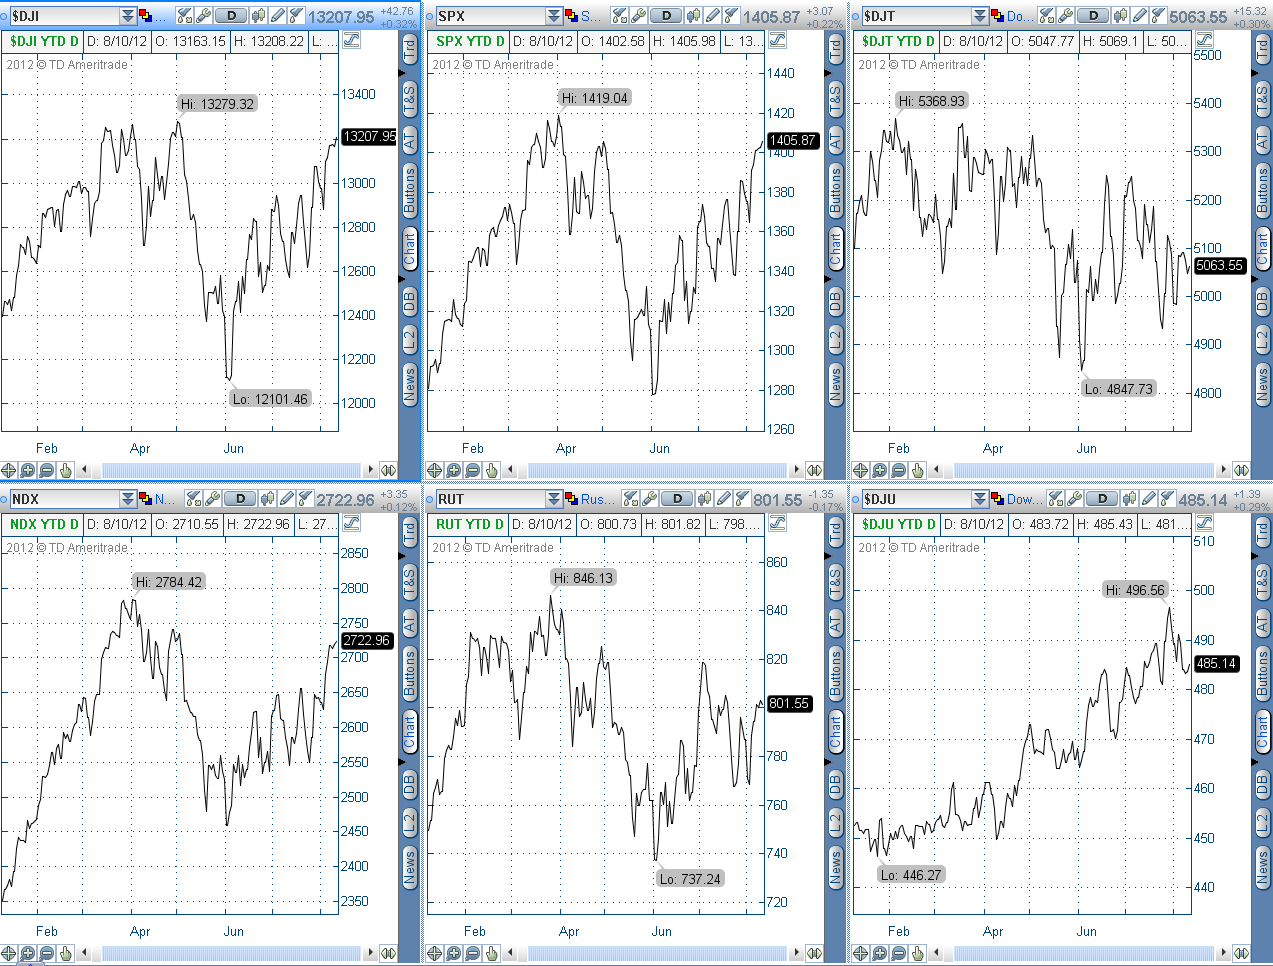
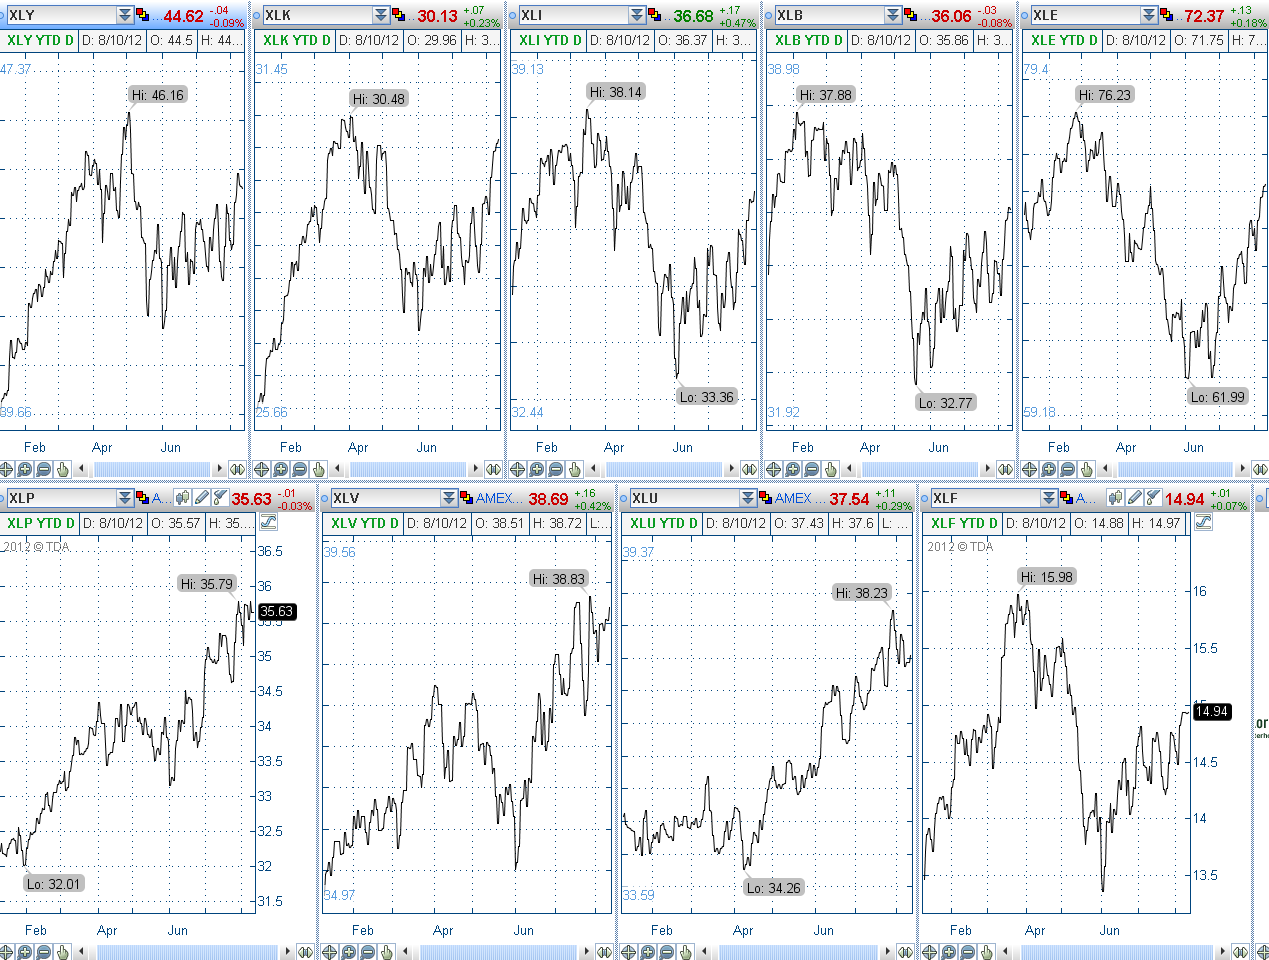
With the exception of the Dow Utilities Index and the Utilities Sector, all Indices and Sectors remained above last week's closing swing low. The Utilities Index closed just below last week's closing swing low, while the Utilities Sector closed just above...ones to watch to see if this weakness builds, or if it was temporary. The others either continued with a small advance or simply high-based.
My closing targets for Friday, as mentioned in that post, were reached on:
- Nasdaq 100 (just 0.04 points shy of target, but close enough)
- Russell 2000
- Materials Sector
- Energy Sector
- Technology Sector
- Financials Sector
The Transports Sector has yet to make a higher closing swing high and is one to watch to see if strength improves or if weakness builds.
The others still have their closing targets to reach and are ones to watch to see whether they strengthen or weaken.
The Year-to-Date Daily chart below of the SPX:VIX ratio chart shows that the S&P 500 Index finally gained traction mid-week and closed the week higher, as volatility continued to decline. Its next resistance level to overcome is 97.50. 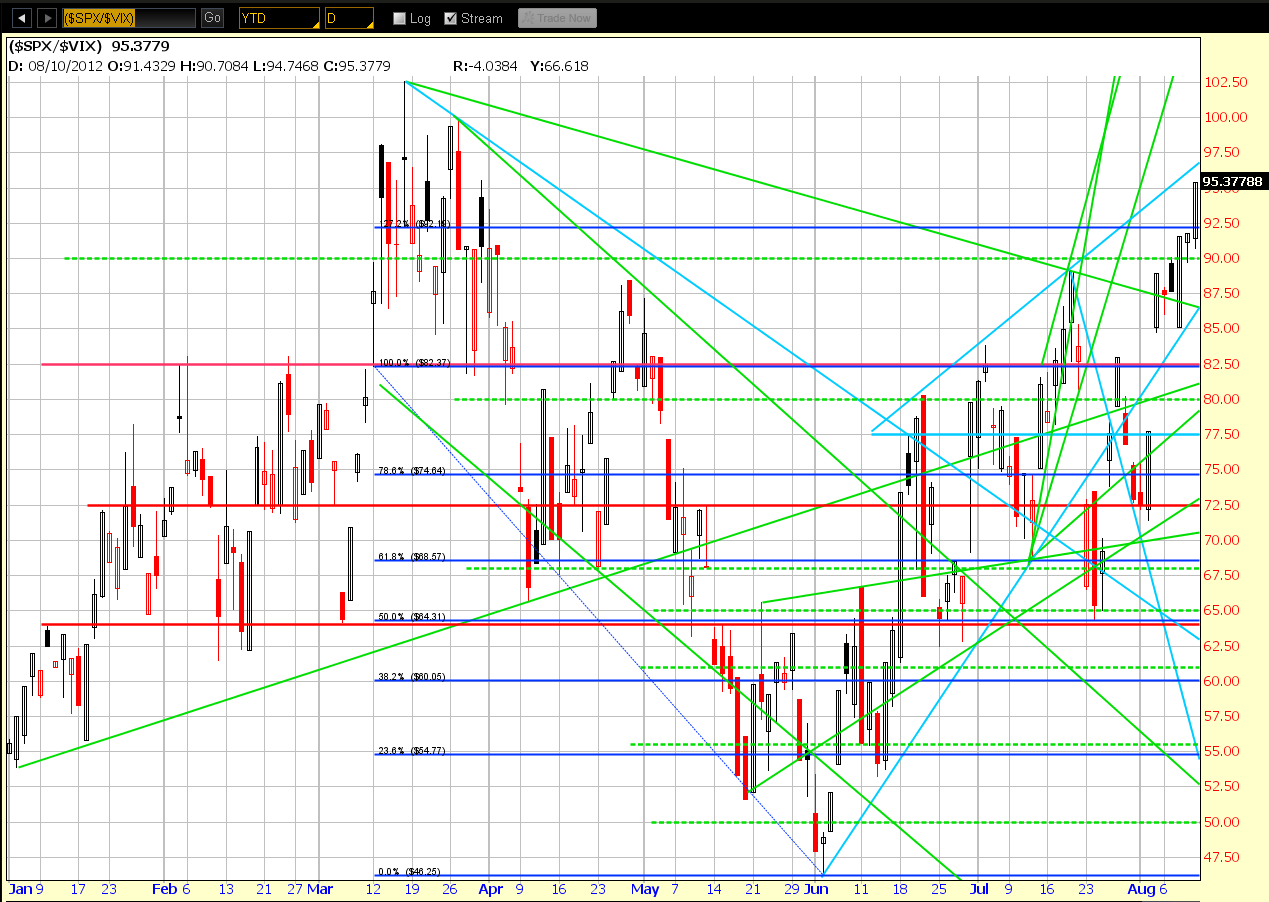
The Year-to-Date Daily chart below of the RUT:RVX ratio chart shows that the Russell 2000 Index managed to push through two resistance trendlines to close the week higher. Its next resistance level is around 41.00.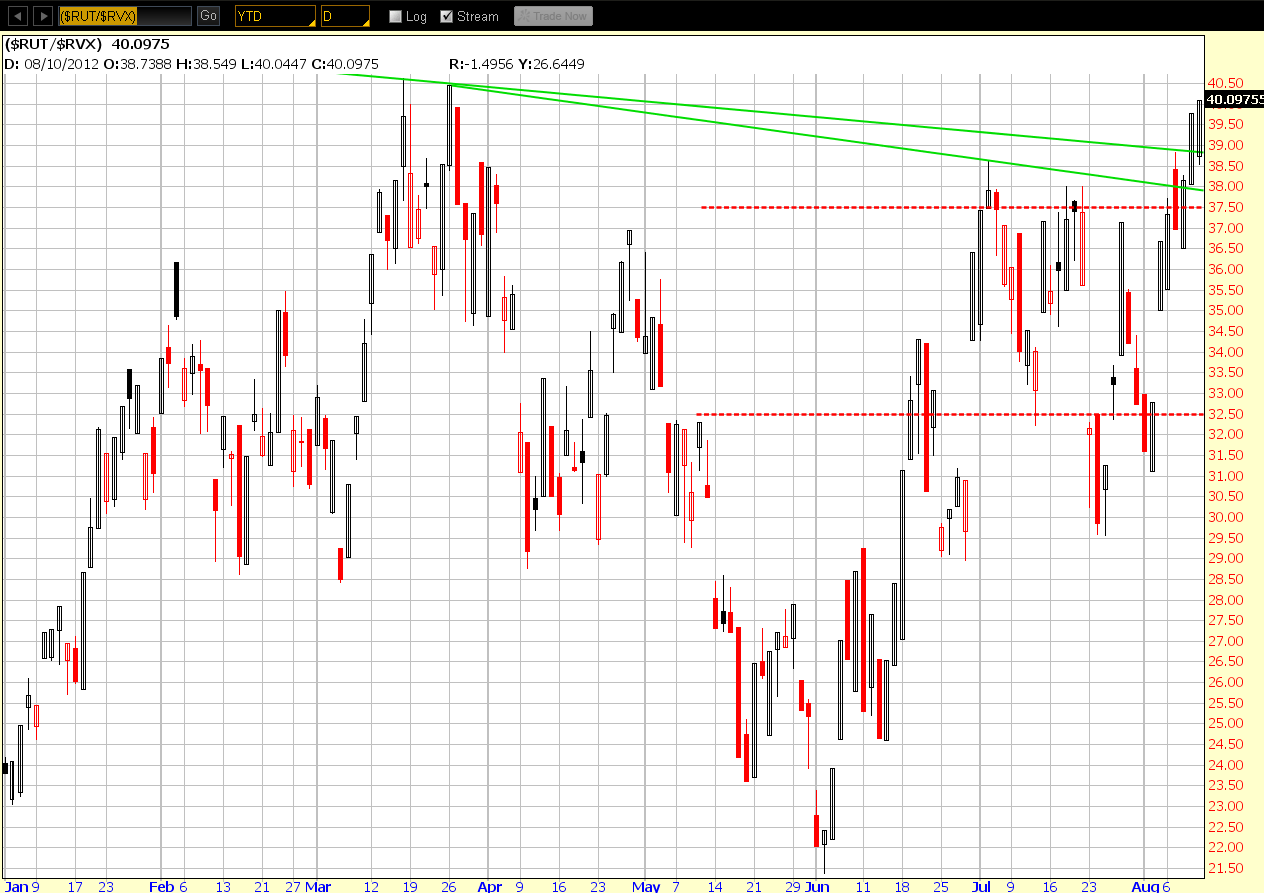
With volatility remaining low, it's possible for the above Indices and Sectors to reach their targets next week. However, I'd keep an eye on the ones that have already reached theirs, or are close to target, to make sure they remain strong to support a continued rally. Otherwise, since they're important Indices and Sectors, they could negatively influence the others. Furthermore, since next Friday is Options Expiry, we could start to see some profit-taking begin, perhaps mid-week or so.
The next 1-Year Daily chartgrid features Germany and France, as well as the PIIGS countries (Portugal, Italy, Ireland, Greece, and Spain). Germany and France have continued to advance recently, and it appears that the others have stabilized, are continuing to build a base, and are attempting to move higher. Italy has made a higher swing high and is one to watch to see if this recent strength continues.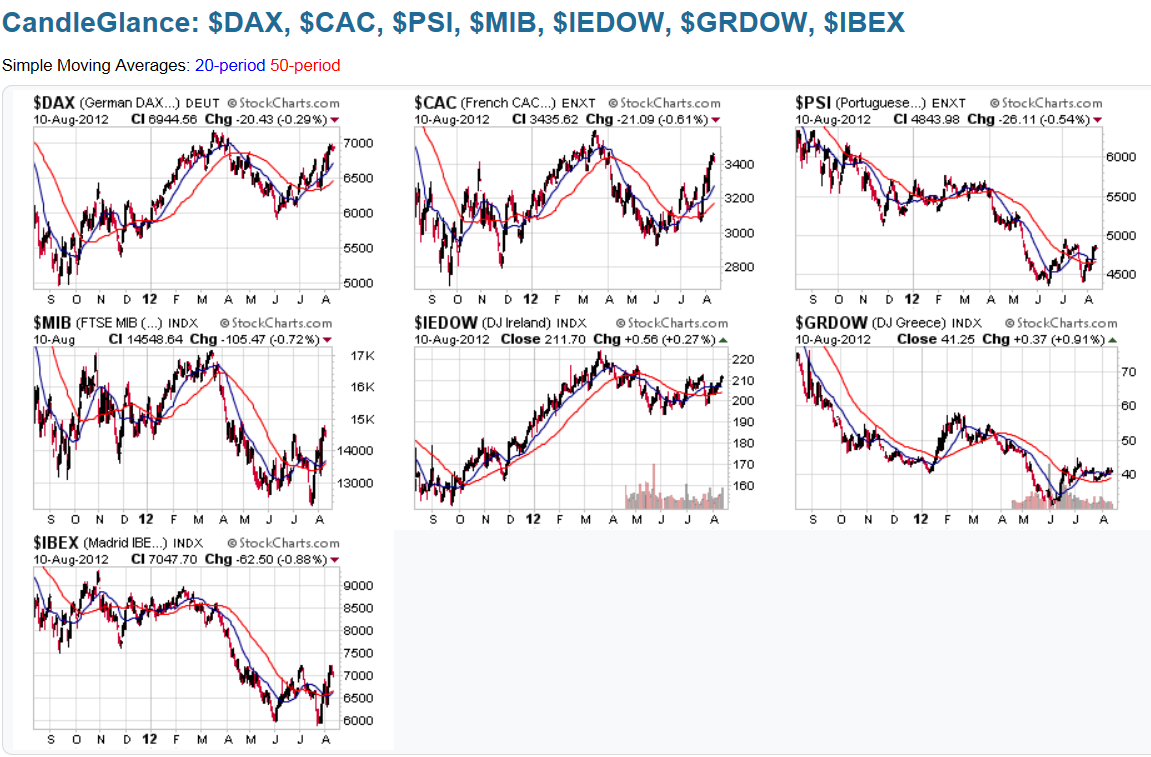
The next 1-Year Daily chartgrid features the Emerging Markets Sector (EEM) and the BRIC countries (Brazil, Russia, India, and China). They have all made some gains recently. China is attempting to stabilize at its 3-Year lows and is one to watch to see if some strength emerges in this Index...although weak economic data of late is continuing to suggest a slowdown in China's consumption, output, and exports, which may hamper much of an advance without government and Central Bank stimulus. Any major destabilization of the European Indices would also likely negatively impact the Shanghai Index.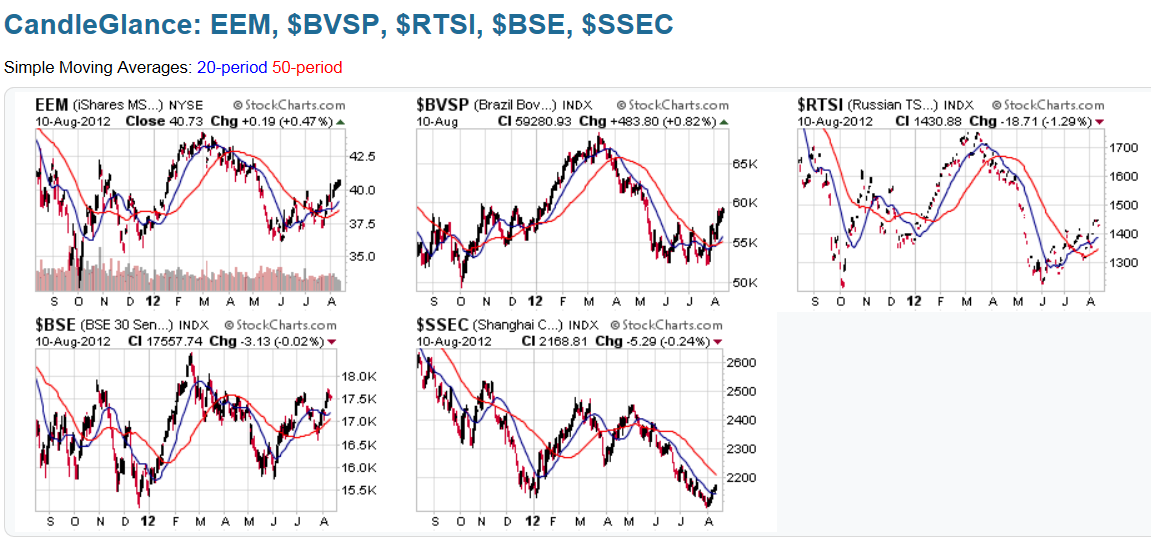
The next 1-Year Daily chartgrid features the Canadian ($TSX), Japanese ($NIKK), and World Indices. The have all advanced recently and are at/near major resistance...ones to watch to see if they can recapture and hold above resistance, or whether some profit-taking occurs.
The next 1-Year Daily chartgrid features the Commodities ETF (DBC), Agricultural ETF (DBA), Gold, Oil, Copper, and Silver. Commodities and Oil have advanced recently. Agriculture is high-basing, and Gold, Copper, and Silver are stuck in a sideways base near their 1-year lows.
Commodities, Oil, and the Canadian Index are ones to watch to see what effect China's Shanghai Index has on them, if any, over the next days/weeks.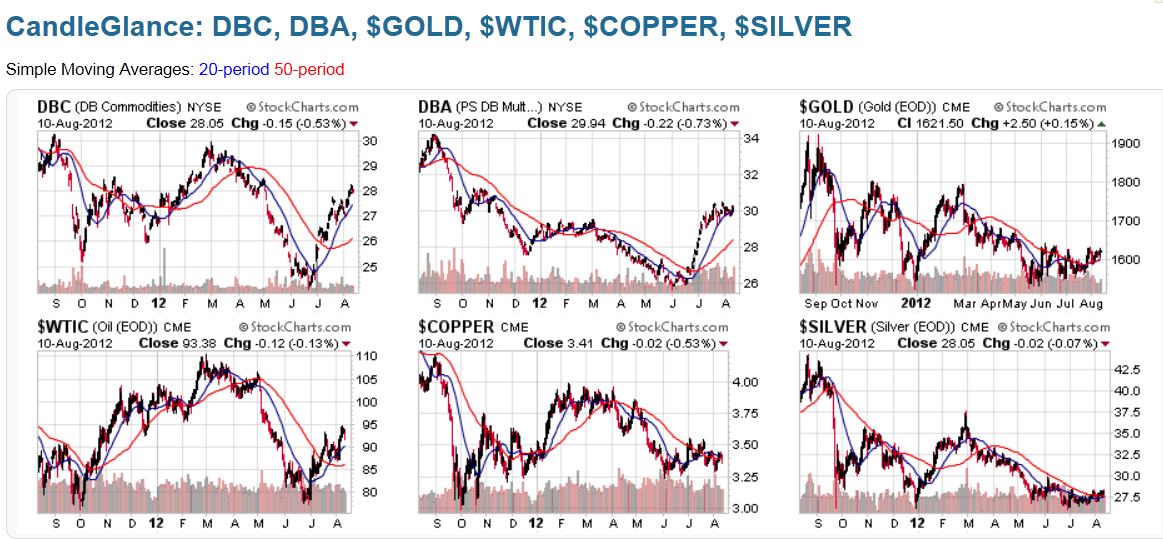
The next 1-Year Daily chartgrid features the seven Major Currencies (U.S. $, Euro, Canadian $, Aussie $, British Pound, Japanese Yen, and Swiss Franc). The U.S. $ has begun to show some weakness recently, while the Euro has remained weak, although it is attempting to form a base and stabilize at these levels...one to watch, as a drop and hold below this year's low could drag the European Indices down, as well. The Canadian and Aussie $s have made large gains from their June lows and are ones to watch, along with Commodities, Oil, and the Canadian and Shanghai Indices, as mentioned above.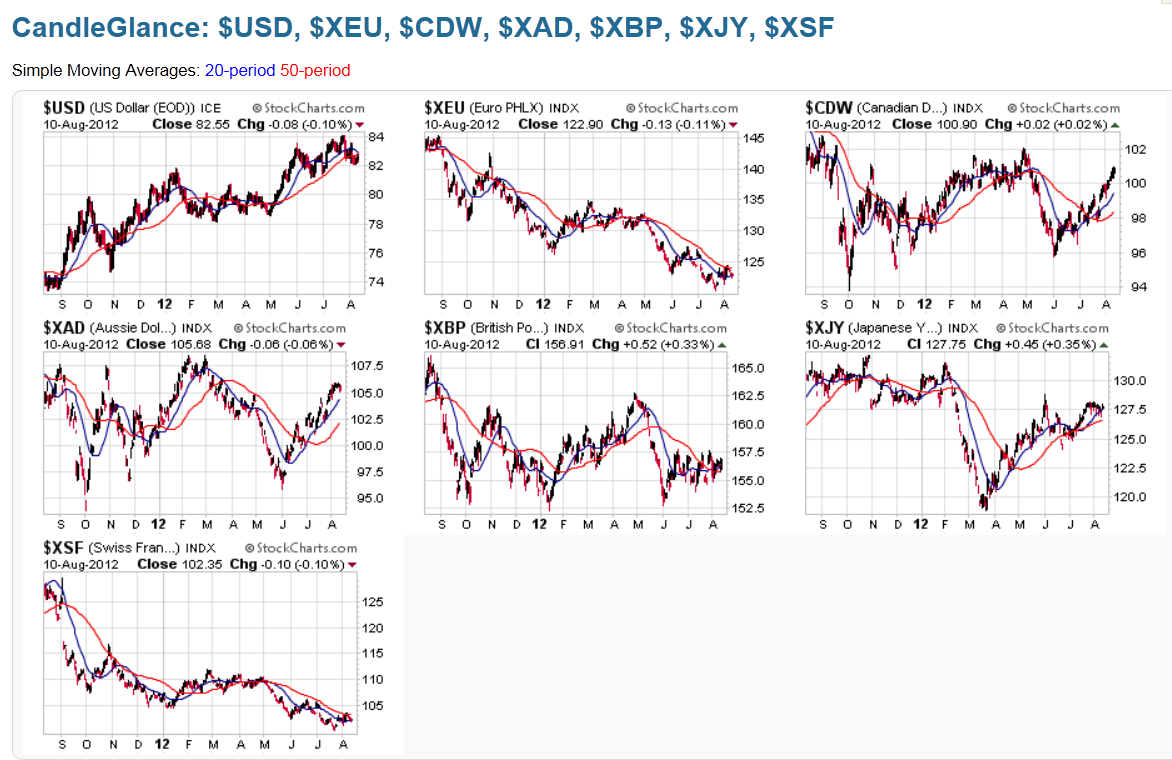
In summary, the big questions seem to revolve around whether Europe and China can continue to stabilize and advance without major economic stimulus measures, and whether Commodities, Agriculture, Oil, and equities can continue to advance without negatively impacting inflation and low interest rates...a delicate balance to be considered by World Central Banks and governments, indeed.
