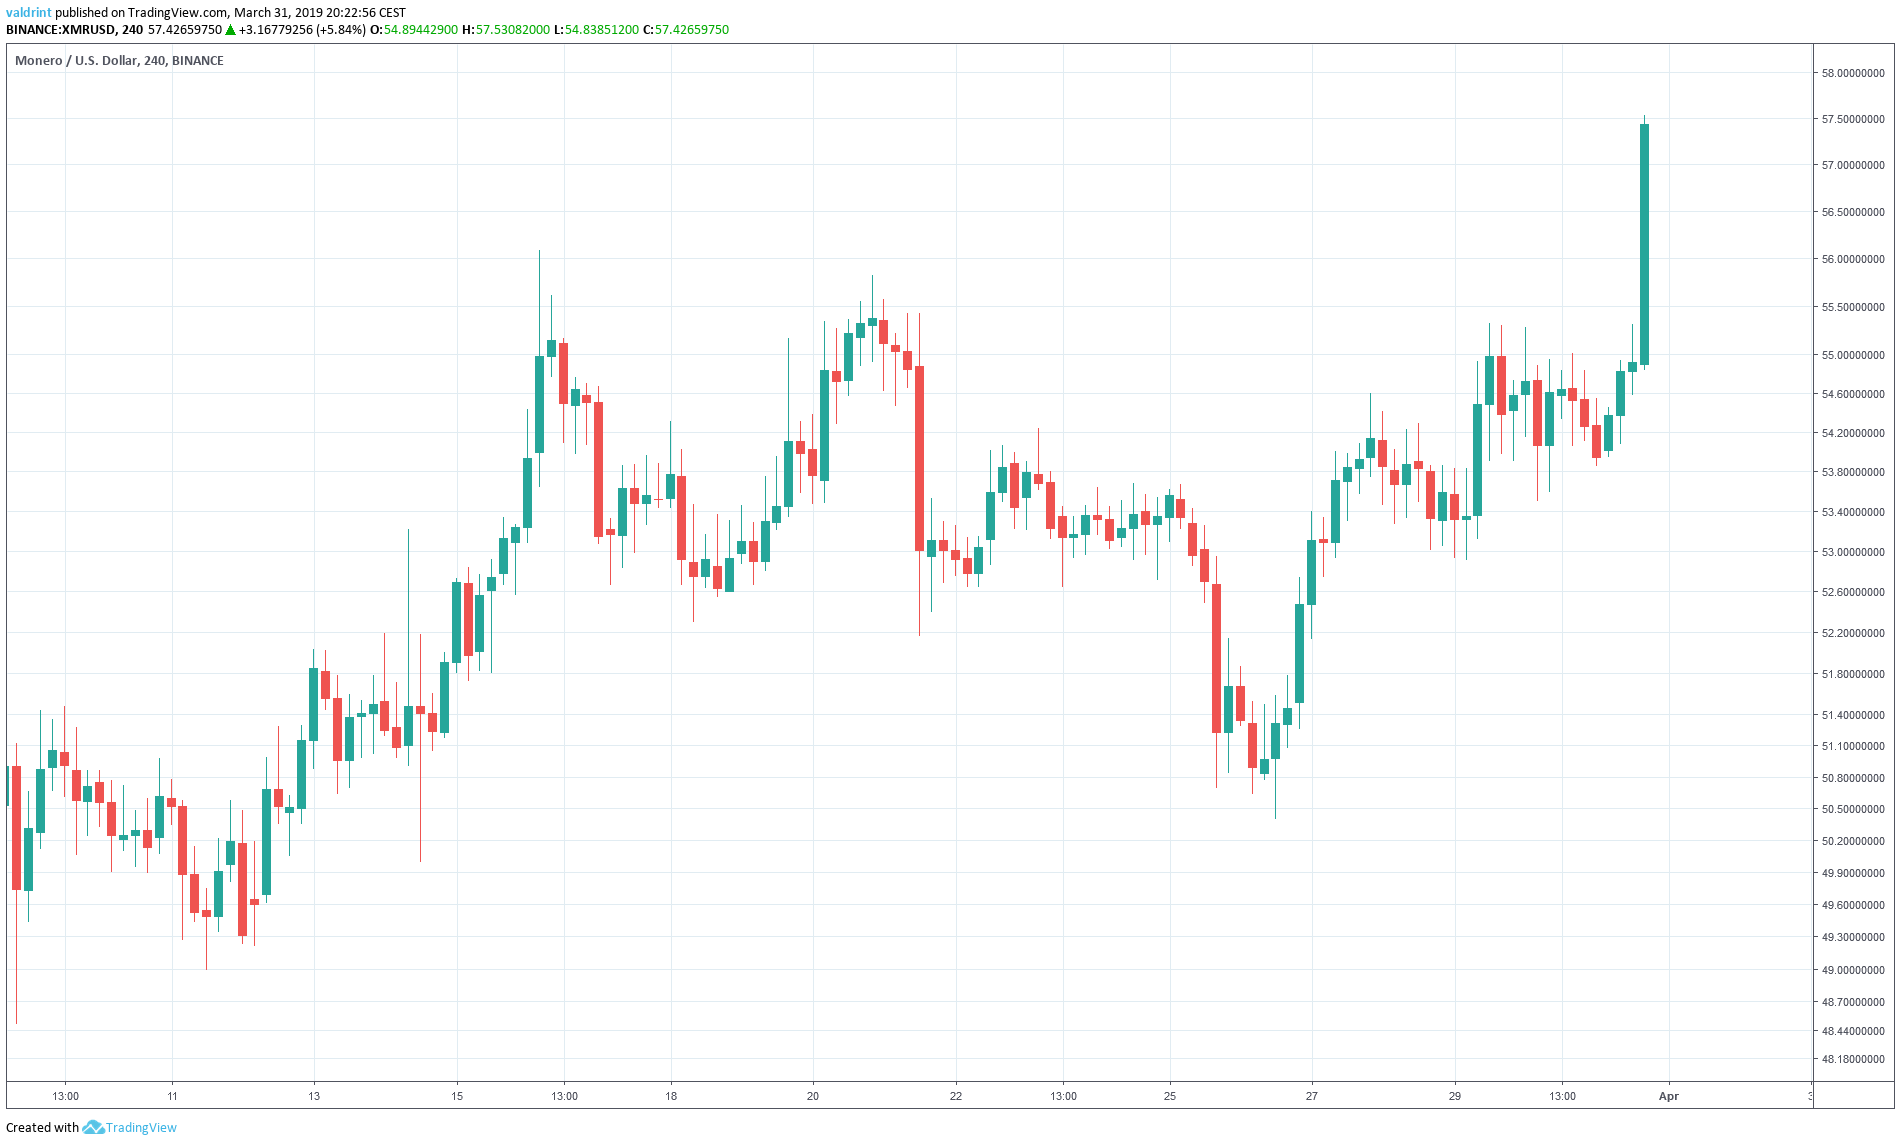
On March 11, the price made a low of $48.90. A gradual uptrend brought prices to a high of $56.08 on Mar 16.
A downtrend with significant volatility brought XMR to lows near $50 on Mar 26.
Subsequently, a gradual uptrend preceded a rapid price spike. At the time of writing on March 31, a high $57.53 was reached:
Monero (XMR): Trends And Highlights For March 31
- Monero has been on a gradual uptrend since Mar 1.
- XMR broke out from a symmetrical triangle on Mar 31.
- The breakout occurred at a significant volume.
- There is resistance near $59 and $65.
Symmetrical Triangle
The price of XMR on Binance is analyzed at four-hour intervals from March 11 to Mar 31 to define its current trading pattern.
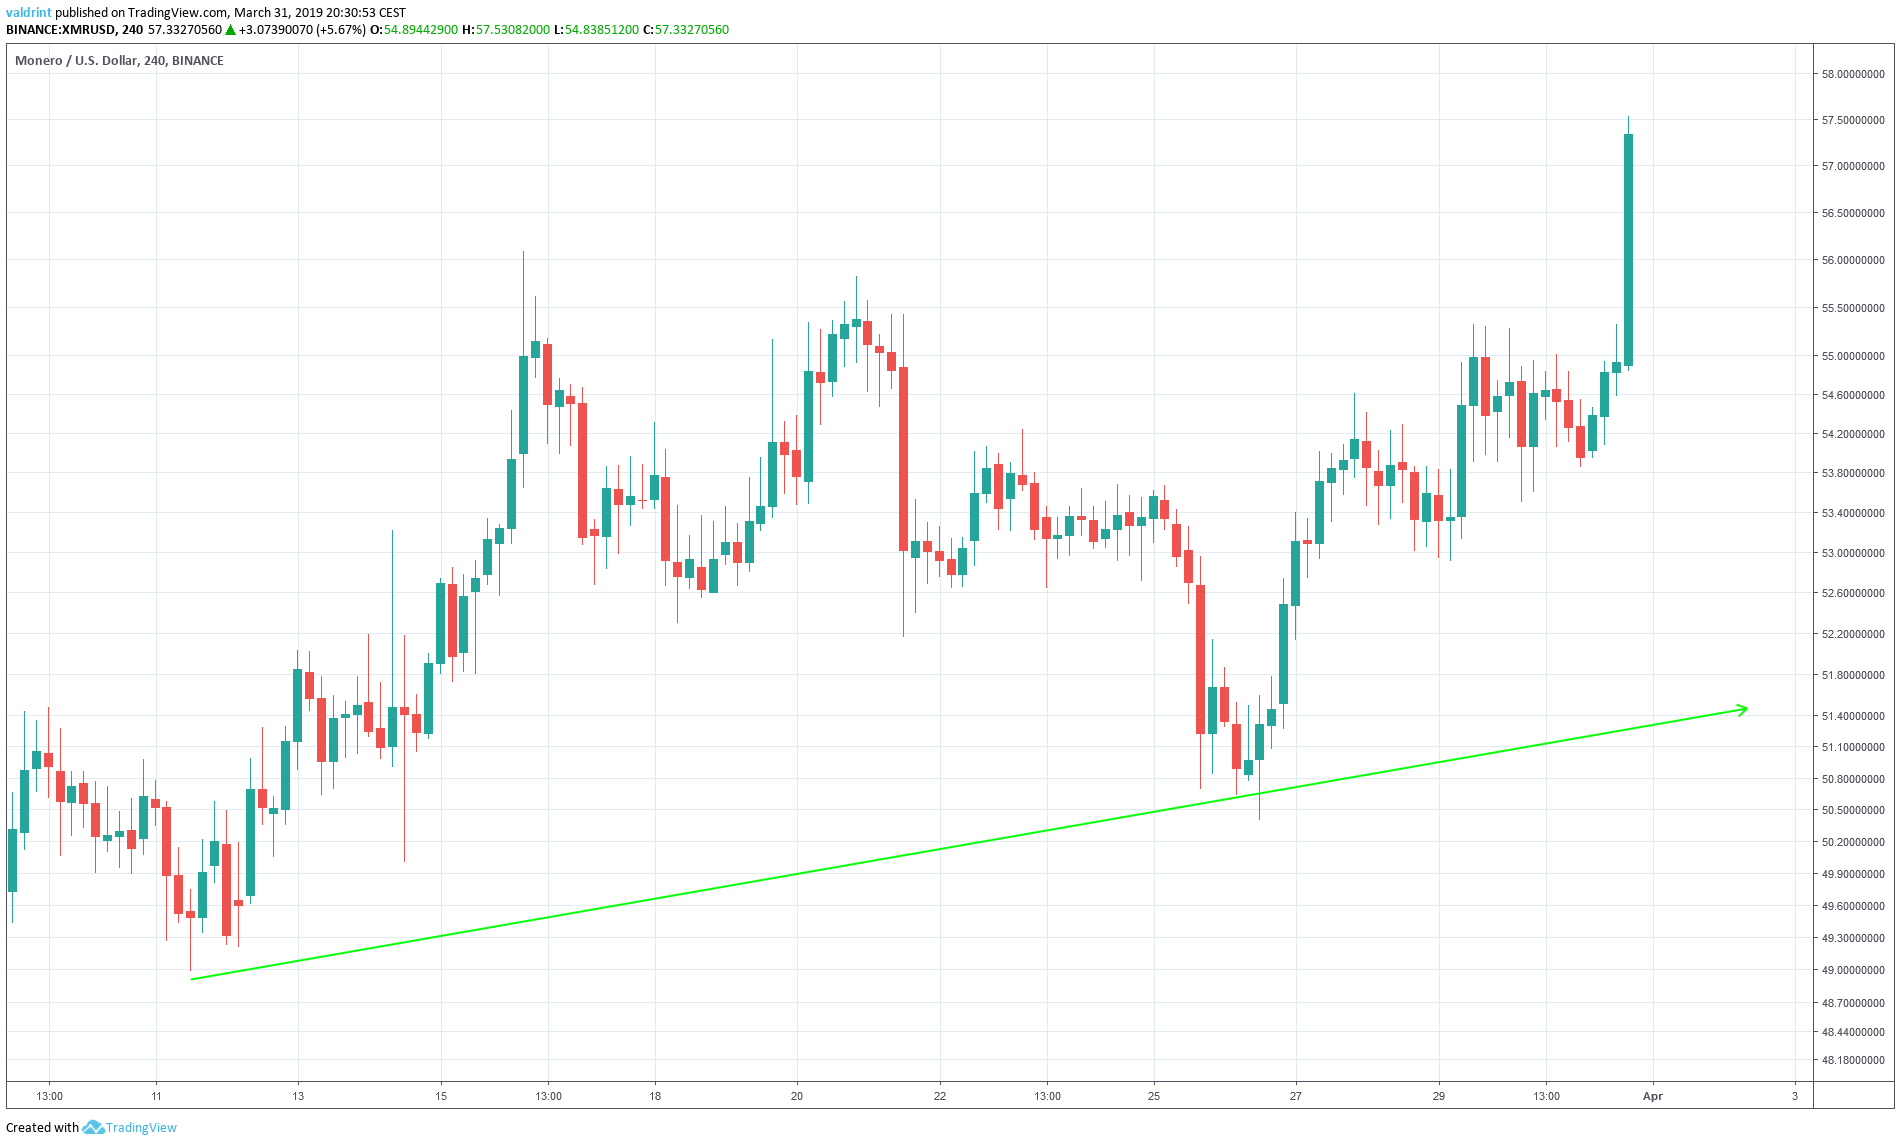
On March 11, the price made a low of $48.90. A sharp increase followed. It was preceded by a gradual decrease.
Since then, it has made successive higher lows. Tracing these lows gives us an ascending support line:
The price made a high of $56.08 on Mar 16. Several market cycles have been completed, with each high being lower than the previous one.
Tracing these highs gives us a descending resistance line. The resistance and support lines combine to create a symmetrical triangle:
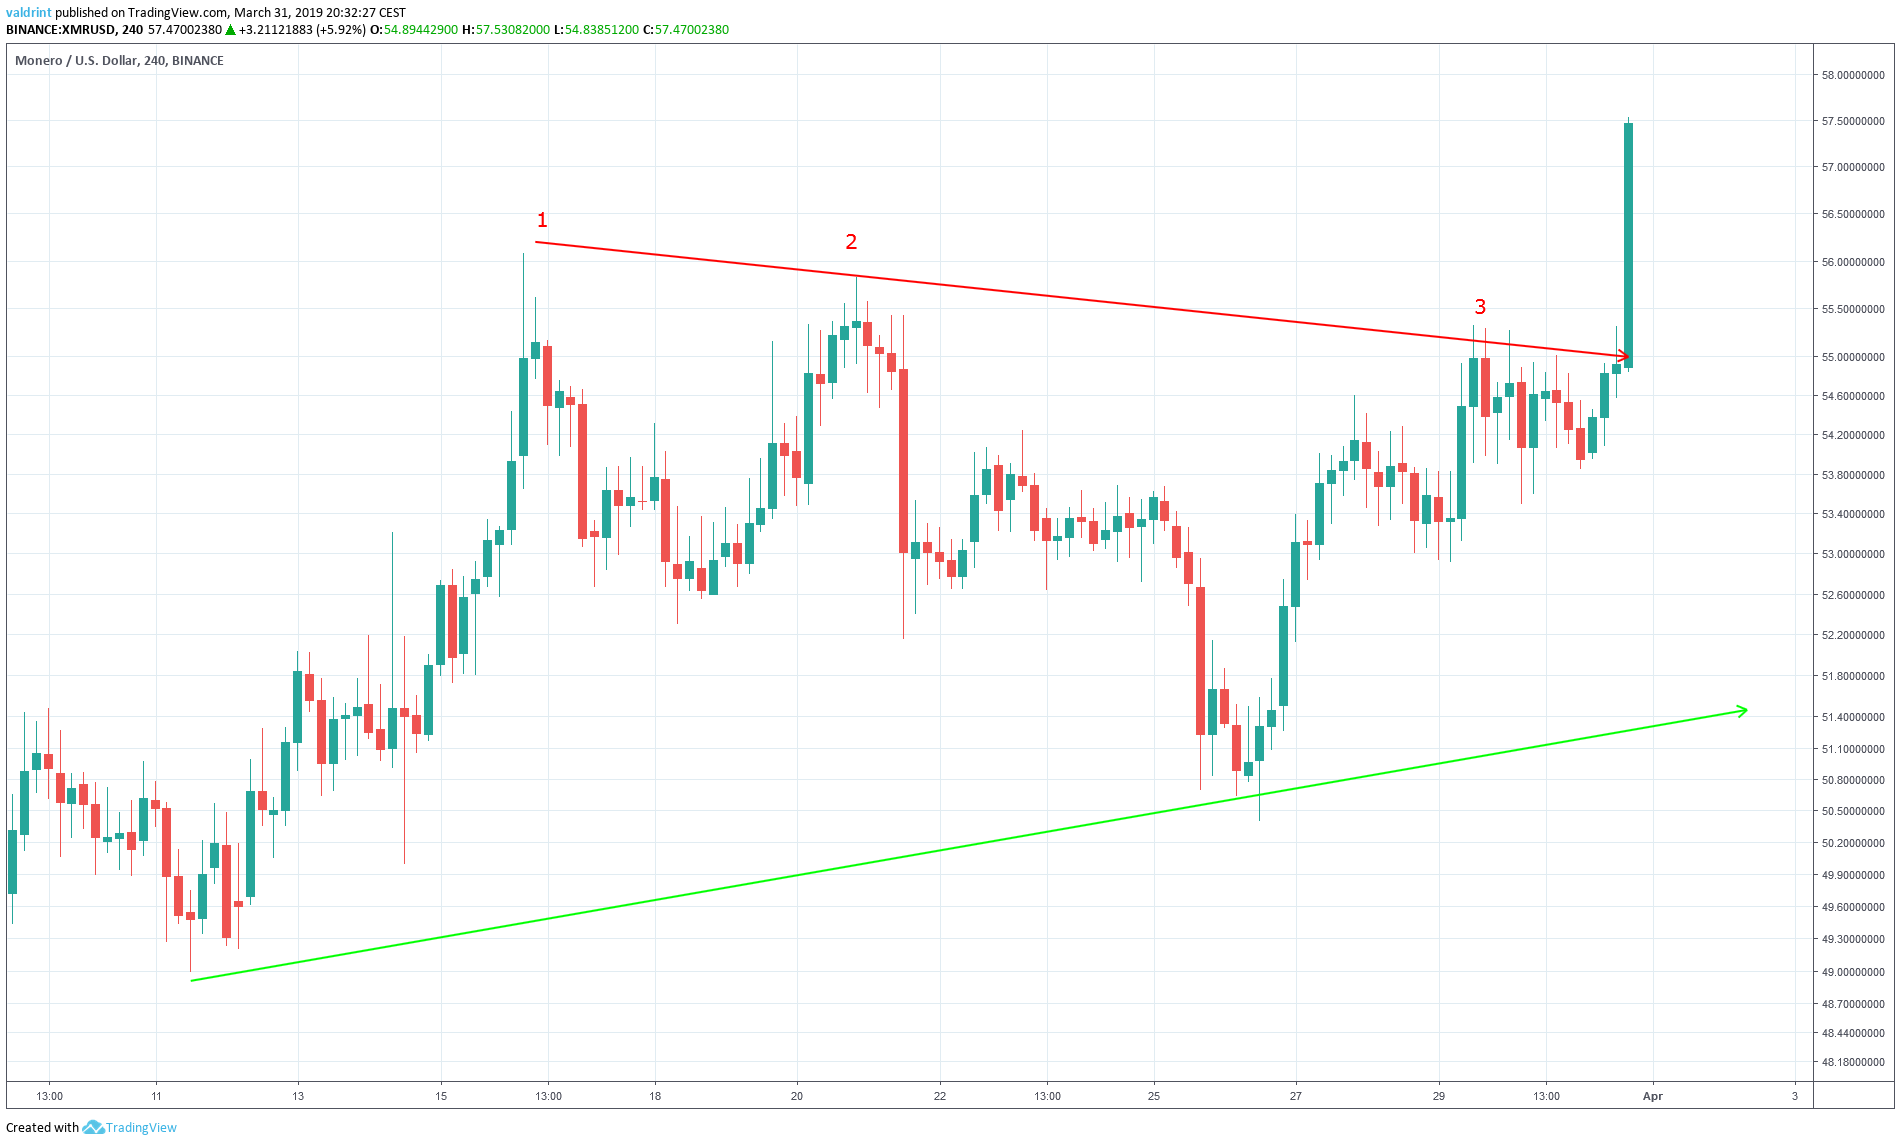
The triangle is a neutral pattern. Theoretically prices should rise and fall between the channel.
However, a breakout from this channel took place on March 31 making price decreases and increases equally likely.
Two possibilities now seem likely:
- If the breakout was valid, prices should continue increasing. These increases could be rapid and lead past $60.
- If the breakout was false, prices should fall below the resistance line in the near future. It should then continue trading within the pattern defined above.
To better assess which is more possible, we must incorporate technical indicators into this analysis.
Volume
We begin with volume.
Volume is a tool used by traders to indicate how much as a given asset is bought or sold in a given period of time.
Volume is analyzed alongside the price of XMR on Binance at two-hour intervals from Mar 15 to Mar 31:
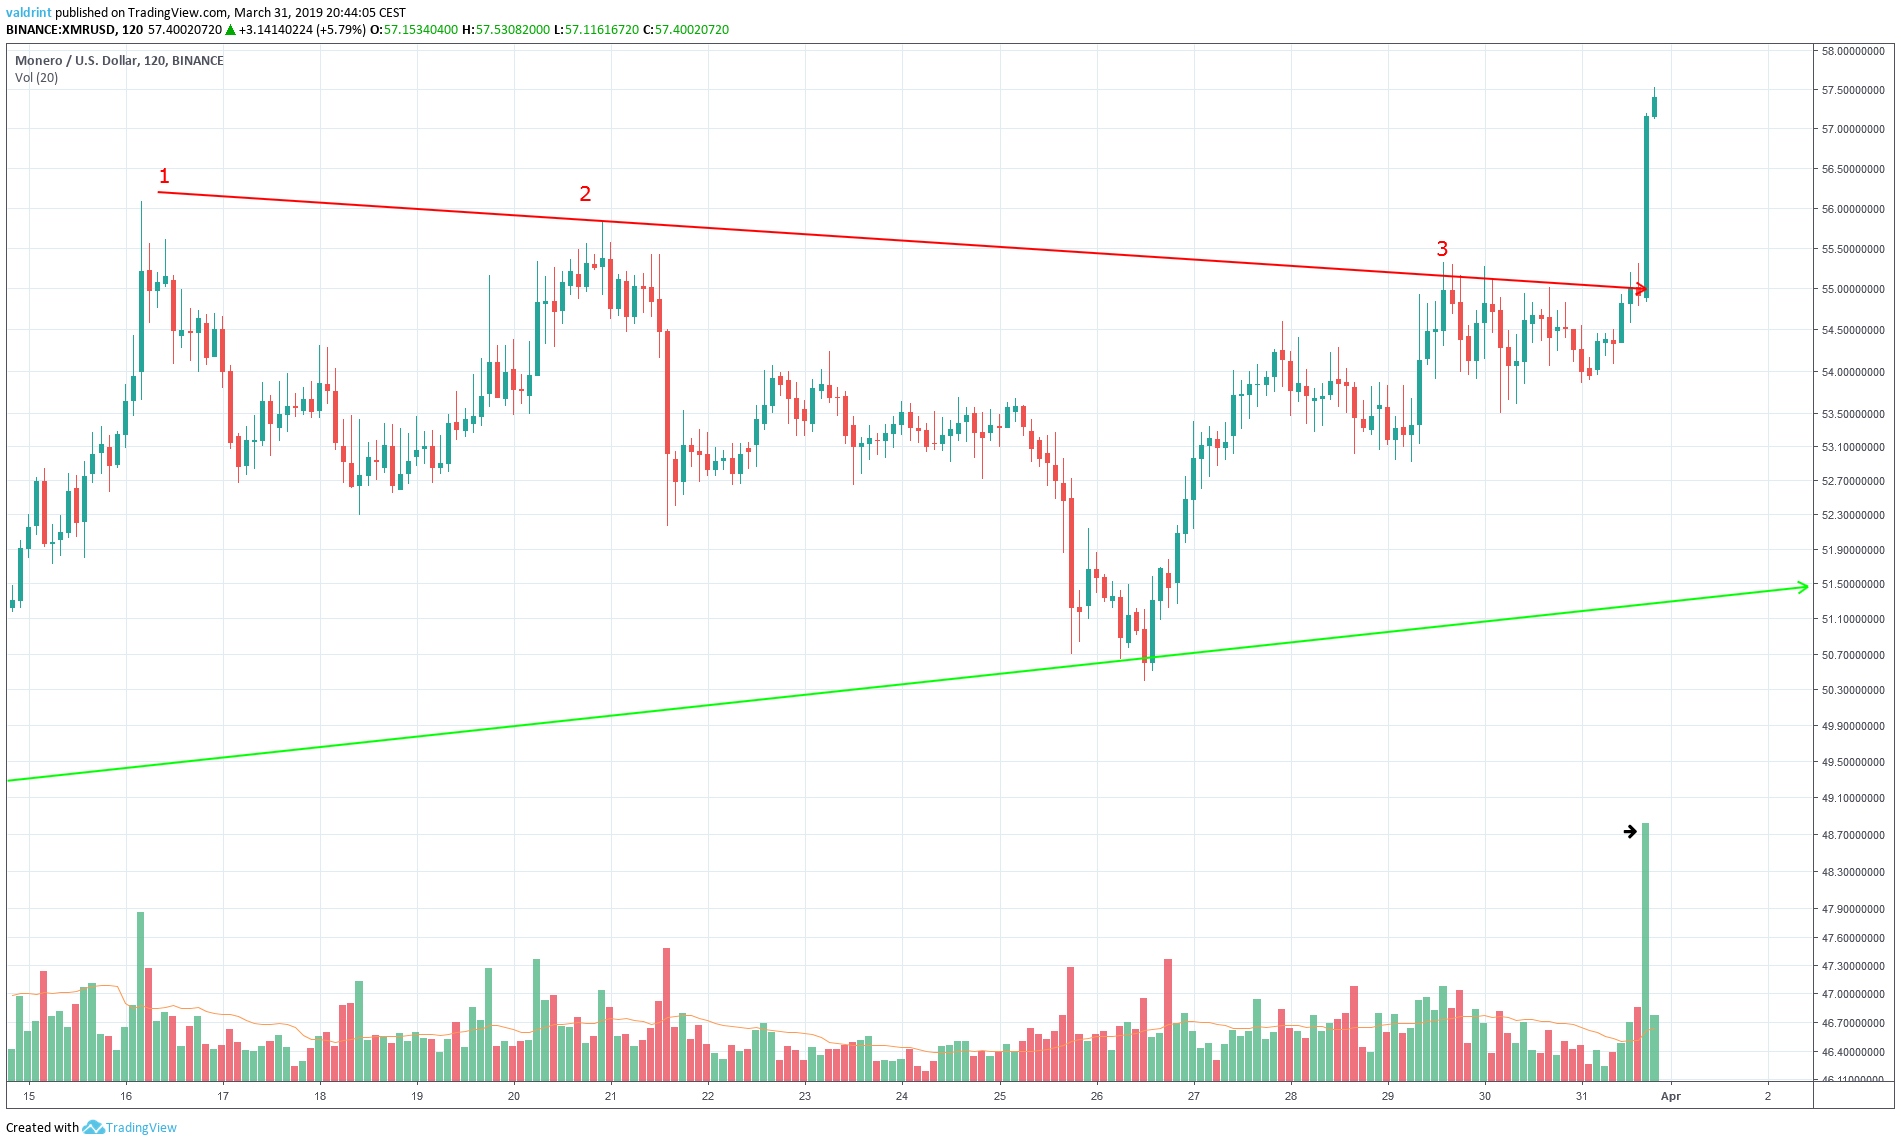
The volume on the two-hour candle from 18:00 to 20:00 (GMT+1) measured on the Binance exchange was $24,042,000.
That is more than double the amount on any other candle since Mar 17.
According to this indicator, the breakout was legitimate and the price is likely to continue increasing. However, we cannot discount the possibility of a slight drop before future rise. Such a drop might represent a correction from rapid price spikes on Mar 31 without disturbing the gradual prcie increases seen since Mar 26.
Future Movement And Summary
In order to better visualize possible future price levels, the price of XMR on Binance is analyzed at 12-hour intervals from Dec. 1, 2018 to March 31, 2019 alongside resistance and support areas.
Resistance and support areas are formed when the price revisits the same level several times. They indicate possible future prices based on past patterns.
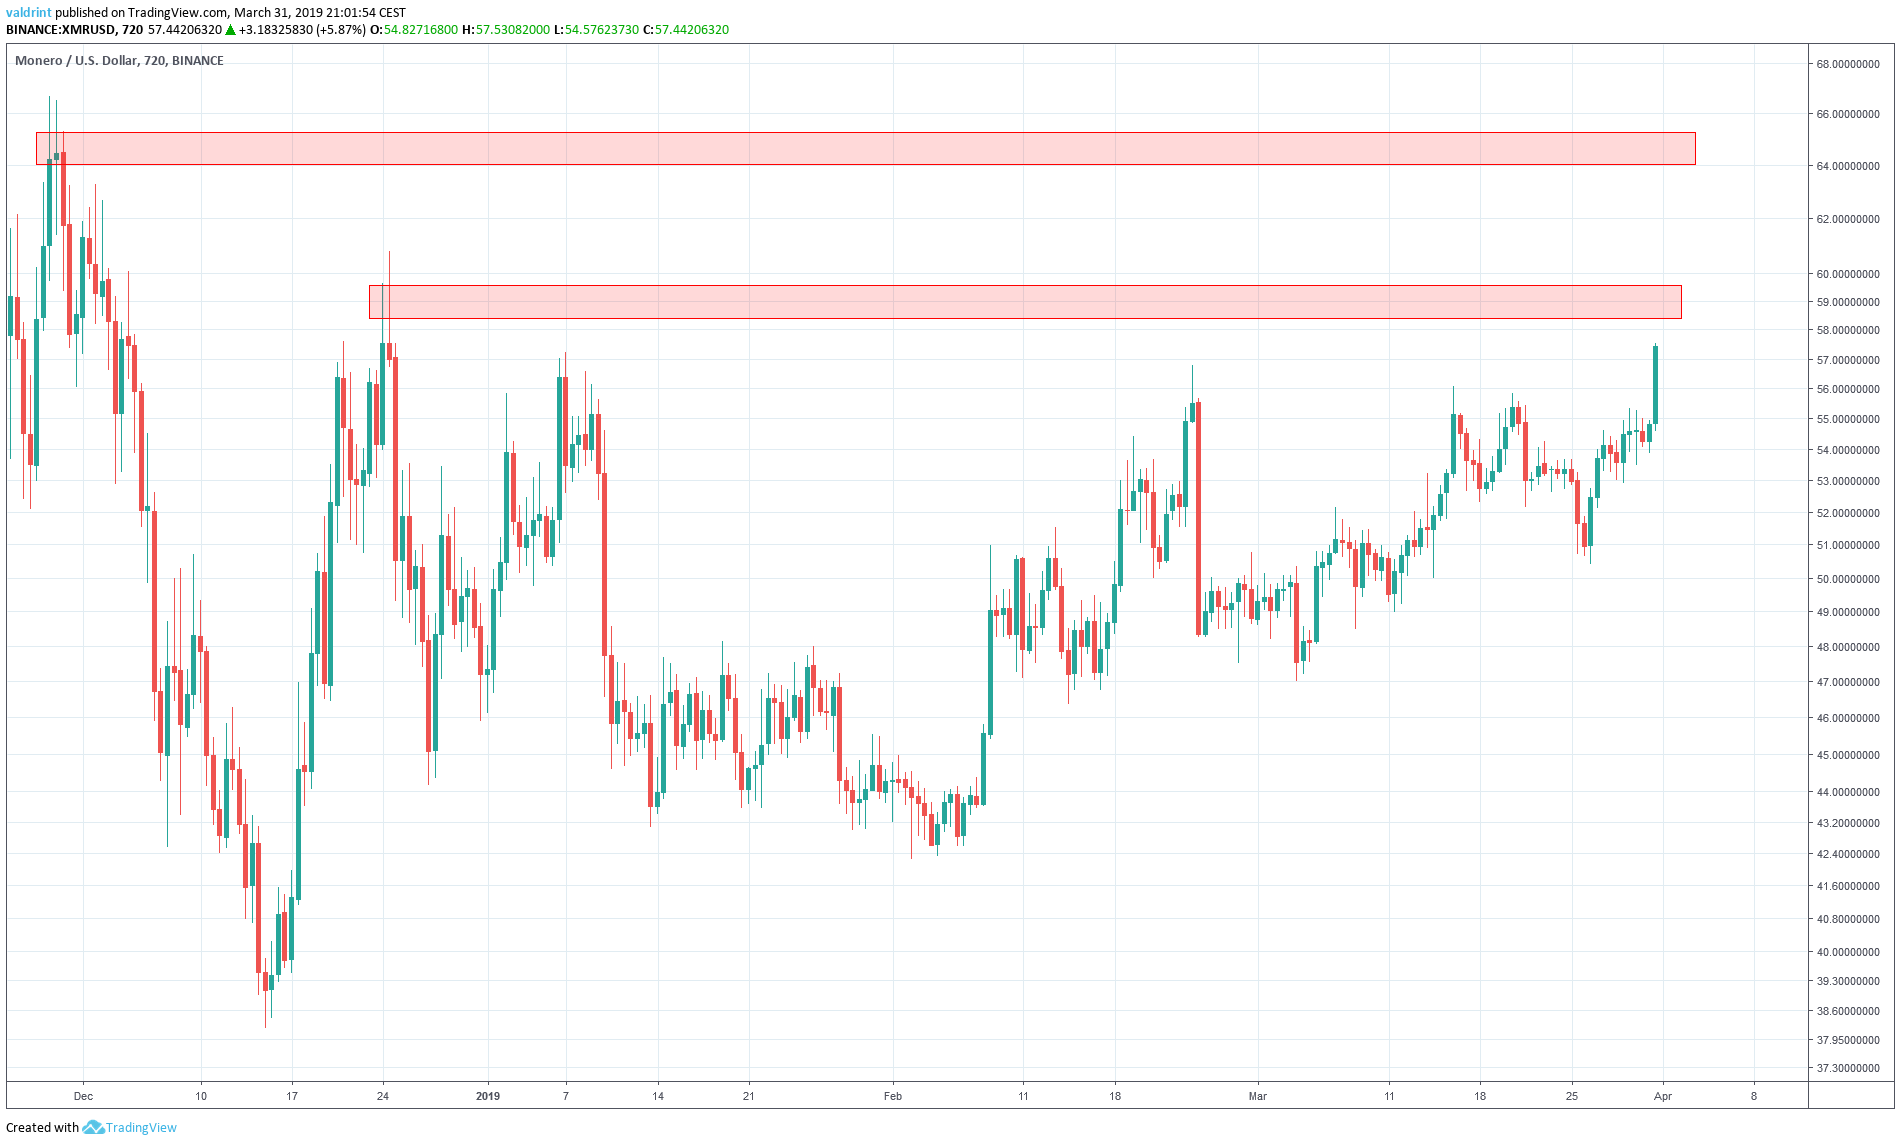
The first resistance area is found near $59. The second resistance area is found near $65.
According to this analysis, it is likely that the price of Monero will keep increasing and reach at least one of these areas.
Do you think the price of Monero (XMR) will keep increasing? Let us know your thoughts in the comments below.
Disclaimer: This article is not trading advice and should not be construed as such. Always consult a trained financial professional before investing in cryptocurrencies, as the market is particularly volatile.
