
Premium scientific & technical instruments company MKS Instruments, Inc. (NASDAQ:MKSI) reported better-than-expected fourth-quarter 2017 results.
The company noted that this stellar performance stemmed from the benefits accrued from its growth-oriented business investments and successful integration of Newport Corporation (acquired in April 2016).
Earnings
Quarterly adjusted earnings came in at $1.71 per share, handily outpacing the Zacks Consensus Estimate of $1.64. Also, the bottom line came in higher than the year-ago tally of $1.05 per share.
Adjusted earnings for 2017 came in at $5.96 per share, surpassing the Zacks Consensus Estimate of $5.87. In addition, the bottom line came in higher than $3.03 per share recorded in the prior-year period.
Revenues
Quarterly revenues of $511.8 million surpassed the Zacks Consensus Estimate of $500 million. The top line also came in 26.3% higher than the prior-year figure.
Sales of Products during the quarter came in at $463.9 million, up from the year-ago tally of $359.8 million. Sales of Services during the reported quarter totaled $47.9 million compared to $45.4 million recorded in the year-earlier period.
Revenues for 2017 were $1.92 billion, outpacing the Zacks Consensus Estimate of $1.90 billion. The top line surged 47.9% year over year. This upside was driven by elevated semiconductor and other advanced markets’ demand.
MKS Instruments, Inc. Price, Consensus and EPS Surprise
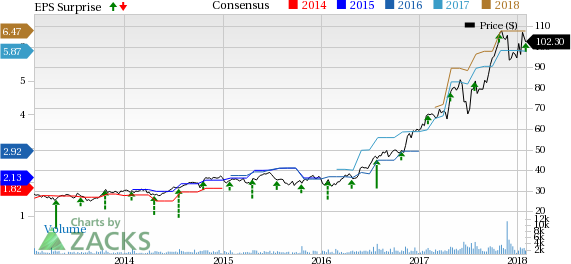
MKS Instruments, Inc. Price, Consensus and EPS Surprise | MKS Instruments, Inc. Quote
Costs and Margins
Total cost of revenues during the quarter was $273.5 million, up from $221.7 million recorded in the prior-year quarter. Adjusted gross profit margin during the quarter came in at 46.6%, expanding 130 basis points (bps) year over year.
Selling, general and administrative expenses totaled $72.5 million, higher than $67.6 million incurred in the year-ago quarter. In addition to this, research and development expenses came in at $33 million, flaring up from $32.9 million reported in fourth-quarter 2016. Adjusted operating margin in the reported quarter was 25.9%, up 530 bps year over year.
Adjusted gross profit margin for 2017 was 46.5%, up 280 bps year over year. Adjusted operating margin was 2017 was 24.6%, up 590 bps year over year.
Balance Sheet and Cash Flow
Exiting the fourth quarter, MKS Instruments had cash and cash equivalents of $333.8 million, up from $228.6 million recorded at the end of 2016. Long-term debt came in at $390 million, down from $601.2 million recorded on Dec 31, 2016.
At the end of 2017, MSK Instruments generated $355.2 million cash from operating activities, up from $180.1 million cash generated in the year-ago quarter. Capital expenditure came in at $31.3 million, up from $19.1 million recorded in the comparable period last year.
Outlook
On grounds of the existing market conditions, MKS Instruments anticipates to report revenues within $510-$550 million and earnings within $1.86-$2.12 in first-quarter 2018.
As per the new operating model (launched on Jan 31, 2018), MKS Instruments anticipates to generate roughly $2,200 million revenues and $8.55 per share of adjusted earnings in the current year. Adjusted operating margin for the year is predicted to lie in the band of 26-28% (estimations were made as per 2017 U.S. Tax Cut and Jobs Act). MKS Instruments intends to boost its near-term competency on the back of its latest operating model.
Nonetheless, the company believes implementation of the new Tax Cut and Jobs Act in 2018 will help boost its liquidity by lowering the effective tax rate.
Stocks to Consider
Some better-ranked stocks in the Zacks Categorized Computer and Technology Sectorare listed below:
Canon, Inc. (NYSE:CAJ) sports a Zacks Rank of 1 (Strong Buy). The company pulled of an average positive earnings surprise of 17.90% over the preceding four quarters. You can see the complete list of today’s Zacks #1 Rank stocks here.
Advanced Micro Devices, Inc. (NASDAQ:AMD) has a Zacks Rank of 2. The company generated an average positive earnings surprise of 35% during the same time frame.
Applied Materials, Inc. (NASDAQ:AMAT) carries a Zacks Rank of 2. The company recorded an average positive earnings surprise of 2.82% over the last four quarters.
Wall Street’s Next Amazon (NASDAQ:AMZN)
Zacks EVP Kevin Matras believes this familiar stock has only just begun its climb to become one of the greatest investments of all time. It’s a once-in-a-generation opportunity to invest in pure genius.
Click for details >>
MKS Instruments, Inc. (MKSI): Free Stock Analysis Report
Advanced Micro Devices, Inc. (AMD): Free Stock Analysis Report
Canon, Inc. (CAJ): Free Stock Analysis Report
Applied Materials, Inc. (AMAT): Free Stock Analysis Report
Original post
Zacks Investment Research