Summary- Defensive sectors are now performing better over multiple time frames.
- Because defensive sectors are a small part of the SPY (NYSE:SPY), it's doubtful we'll see a meaningful rally in the broader markets.
- Only defensive sector charts are bullish in the six-month time frame.
The tone of sector performance is turning more and more defensive. Let's start with the 3-month time frame: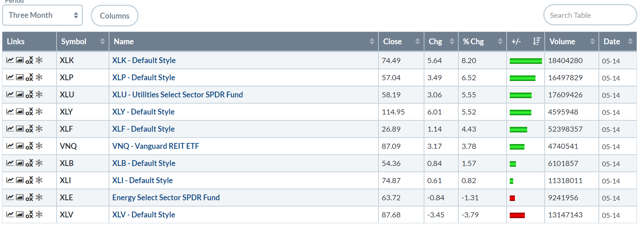
Technology still occupies the number one slot. But staples and utilities are numbers two and three, respectively. While there used to be a larger gap between technology and other sectors on this table, that gap is now narrowing: technology increased 8.2% while staples rose 6.52% -- a difference of 1.68%.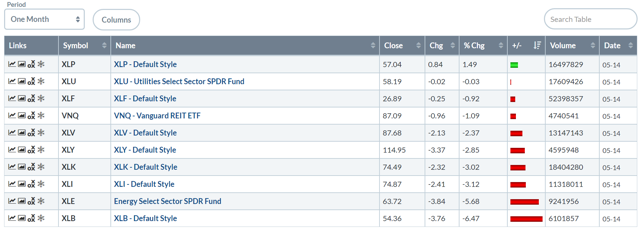
In comparison to the three-month table were 9/10 of industries advanced, the 1-month table is decidedly bearish. Only one sector rose over this time frame. The two top performers are also defensive; staples rose 1.49% while utilities were off marginally. The XLB (basic materials) was the worst performer, which you'd expect in a heightened trade tension environment. Energy is also down thanks to the decline in oil prices.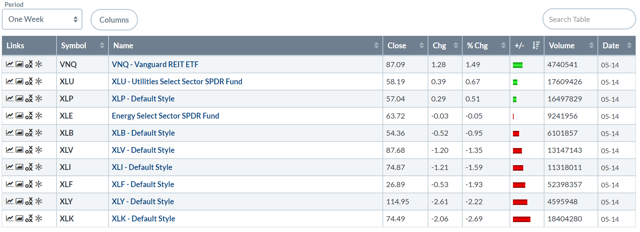
Over the last week, defensive sectors were not only the top performers, but they were also the only sectors to advance. Real estate rose 1.49; utilities advanced .67; staples are up .51. On the flip side are two aggressive sectors: market-darling technology is down 2.69% while consumer discretionary fell 2.22%.
A key problem for the markets going forward is that the stronger performance of defensive sectors means weaker overall index performance:
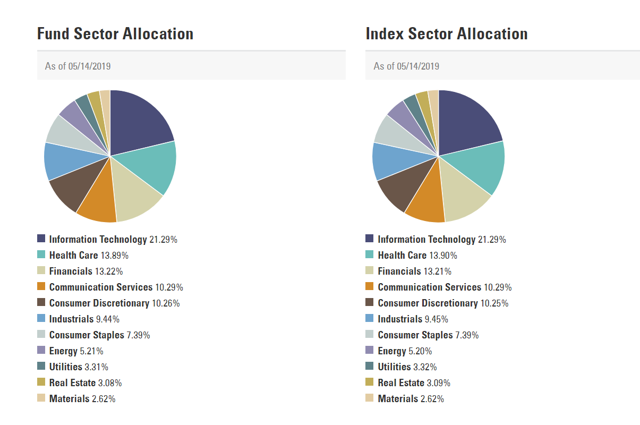
Utilities, staples, real estate, and healthcare combined make-up 28% of the SPY. Technology is by far the largest member of the index, comprising 21%. So, if technology is down a bit more than then the combined four defensive sectors are up, the upward momentum of the defensive sectors is completely negated, making a market advance nearly impossible.
The problem is more pronounced with the QQQ:
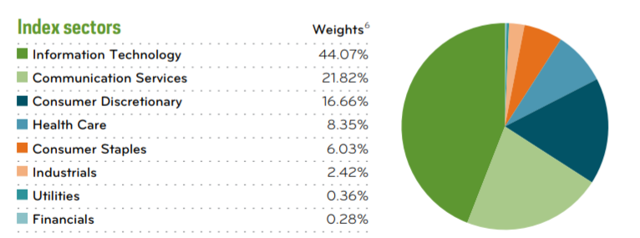
Technology is nearly half the QQQ whereas healthcare, staple, and utilities are 15%. In other words, if technology sells-off, the QQQ is moving lower.
Turning to the charts, the 2-month charts are weak:
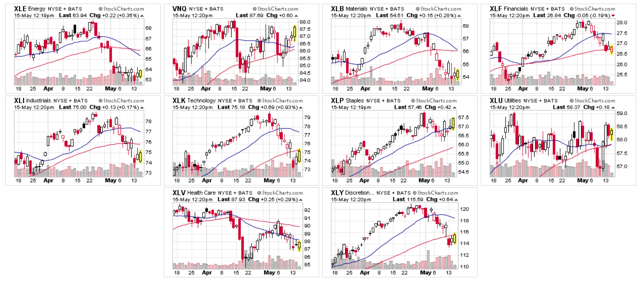
There is not one strong rally; the "best charts" (and I'm using that term relatively" are real estate (top row, second from left), staples (middle row, second from right), and utilities (middle row, far right). All other charts are trending lower.
And we see the same thing in the 6-month charts:
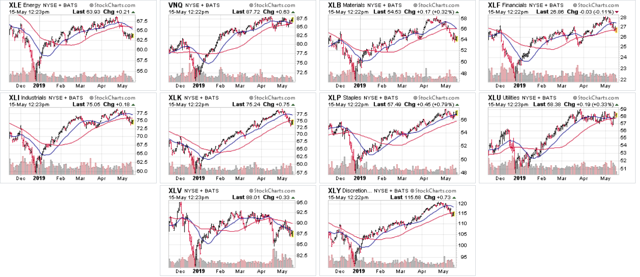
Technology (middle row, second from left)-- which was the top performer for most of this year -- has broken trend is now moving lower, as is consumer discretionary (lower row, far right). Other sectors that have broken trends are energy (top row, far left), financials (top row, far right), and basic materials (top row, second from right). In fact, the best looking charts are defensive.
So -- where does that leave us? It's difficult to see a strong rally in the broader markets. Technology -- "the" key sector -- is weaker, as is consumer discretionary. And the defensive sectors combined just aren't large enough to move the markets higher.
Disclosure: I/we have no positions in any stocks mentioned, and no plans to initiate any positions within the next 72 hours. I wrote this article myself, and it expresses my own opinions. I am not receiving compensation for it (other than from Seeking Alpha). I have no business relationship with any company whose stock is mentioned in this article.
