
Microsemi Corporation (NASDAQ:MSCC) reported better-than-expected fiscal fourth-quarter 2017 results.
Adjusted earnings of $1.09 per share beat the Zacks Consensus Estimate by a penny and came ahead of the guided range of $1.02 to $1.14 at the mid-point. Earnings were up 10.4% sequentially and 19.7% year over year.
Revenues came in at $475.3 million, surpassing the consensus mark by $0.4 million. It exceeded the guided range of $463–$487 million at the mid-point. Revenues were up 3.8% sequentially and 5.6% year over year.
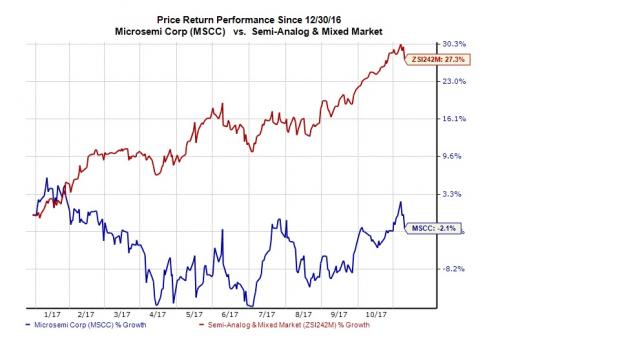
Shares barely moved in afterhours trading. Year to date, Microsemi shares have lost 2.1% of their value against the industry’s 27.3% gain.
The year-over-year top-line growth was driven by robust performance in data center, aerospace & defense and industrial end markets. Managements expects solid momentum in these end markets in fiscal 2018. We believe strategic positioning, strong fundamentals and efficient execution to be tailwinds for Microsemi.
Revenues in Detail
Microsemi generates revenues from the Communications, Defense & Aerospace, Data Center and Industrial markets.
Around 33% ($157 million) of Microsemi’s quarterly revenues came from its largest end market, communications, which stayed flat sequentially but was down 7% year over year. The decrease was primarily attributed to ongoing softness in China.
The aerospace & defense market generated 28% of sales ($136 million), up 19% sequentially and 17% year over year. Satellite and foreign military sales drove the growth.
The data center segment ($109 million) generated 23% of fiscal fourth-quarter revenues. The segment decreased 4% sequentially but increased 14% year over year. The segment performed well year over year driven by continued momentum in performance storage solutions and strength in officer-driven designs and the enterprise market.
Industrial market generated 16% of sales, up 1% sequentially and 6% year over year. The year-over- year growth was driven by strength in atomic clock solutions, electrical vehicle applications and semiconductor capital equipment
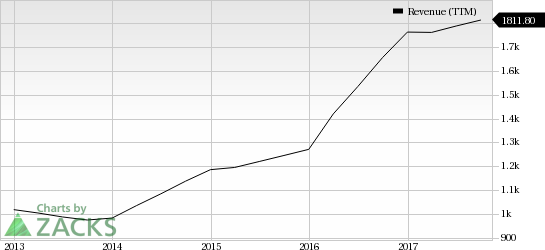
Microsemi Corporation Revenue (TTM)
Margins and Net Income
Non-GAAP gross margin was 64.4%, up 53 basis points (bps) sequentially and 181 bps year over year. The increase was driven by higher revenues and a favorable profitability mix. EBITDA was $171.9 million up 7.9% sequentially and 14.6% from the year-ago quarter.
Non-GAAP operating expenses of $146.2 million decreased 0.7% sequentially and 2.7% year over year. Operating margin of 23.7% was up 146 bps sequentially and 267 bps year over year.
Microsemi generated GAAP net income of $102 million or earnings of 87 cents per share against net loss of $40.5 million or loss of 35 cents per share a year ago.
Balance Sheet
Cash and cash equivalents balance at the end of the fiscal fourth quarter was $144.9 million, down from $166.4 million in the fiscal third quarter. Operating cash flow was $156.9 million compared with $118.7 million in the previous quarter. Capex was $17.6 million compared with $10.6 million in the previous quarter. Free cash flow was $139.3 million compared with $108.1 million in the previous quarter.
Inventories were $239.1 million compared with $231.9 million in the previous quarter. Accounts receivable was $267.9 million compared with $246.5 million at the end of the prior quarter.
Guidance
Microsemi expects first-quarter fiscal 2018 revenues in the range of $448–$472 million. The mid-point of the guided range is lower than the Zacks Consensus Estimate of $461.5 million. Non-GAAP earnings per share are likely to be within 95 cents–$1.07. The mid-point of the guided range is lower than the Zacks Consensus estimate of $1.02.
Zacks Rank and Stocks to Consider
Microsemi carries a Zacks Rank #3 (Hold).
Better-ranked stocks in the broader technology sector include Adobe Systems Incorporated (NASDAQ:ADBE) , Fair Isaac Corporation (NYSE:FICO) and Autohome Inc. (NYSE:ATHM) , all sporting a Zacks Rank #1 (Strong Buy). You can see the complete list of today’s Zacks #1 Rank stocks here.
Long-term earnings growth rate for Adobe, Fair Isaac and Autohome is projected to be 17%, 10% and 18.8%, respectively.
More Stock News: This Is Bigger than the iPhone!
It could become the mother of all technological revolutions. Apple (NASDAQ:AAPL) sold a mere 1 billion iPhones in 10 years but a new breakthrough is expected to generate more than 27 billion devices in just 3 years, creating a $1.7 trillion market.
Zacks has just released a Special Report that spotlights this fast-emerging phenomenon and 6 tickers for taking advantage of it. If you don't buy now, you may kick yourself in 2020.
Click here for the 6 trades >>
Autohome Inc. (ATHM): Free Stock Analysis Report
Fair Isaac Corporation (FICO): Free Stock Analysis Report
Adobe Systems Incorporated (ADBE): Free Stock Analysis Report
Microsemi Corporation (MSCC): Free Stock Analysis Report
Original post
Zacks Investment Research