In the first part of this multi-part research post we highlighted what we are calling a "Crazy Ivan" price event (borrowed from the movie Red Octobe. The one thing we want you to take away from this article is that August 19, 2019 should be a major price inflection date where the price is very likely to begin a new downside price trend in the U.S. and global stock markets. This will likely push commodity prices to extremes and may well push gold and silver into the stratosphere as fear and greed take hold across the planet.
In Part I we mentioned how the VIX and the NQ are set up to react to this "Crazy Ivan" pricing event and how we believe many traders/investors are simply unaware of the potential for this type of large reversion price move. We want to be clear, we believe the U.S. markets will be somewhat immune from extended downside risks. This does not mean there won't be a downside price move and that the markets won't experience the reversion trend. It will likely happen just as we are expecting, yet we believe the U.S. stock markets will quickly recover from the move – as it has done many times in the past.
Our research that highlighted this August 19, 2019 date and the potential for the "Crazy Ivan" price move is rooted in our super-cycle analysis, predictive modeling tools and other specialized proprietary price modeling solutions and utilities. We believe we've identified a key inflection point/date that will start what we are calling a “breakdown move” that will lead to the Crazy Ivan event across the globe. As we stated in the first part of this article, we don't know the exact composition of this event yet, but we do know that it should begin to happen around or after August 19, 2019.
Now, let's get busy digging into the gold and silver charts.
Gold's 2-Week Chart Interval
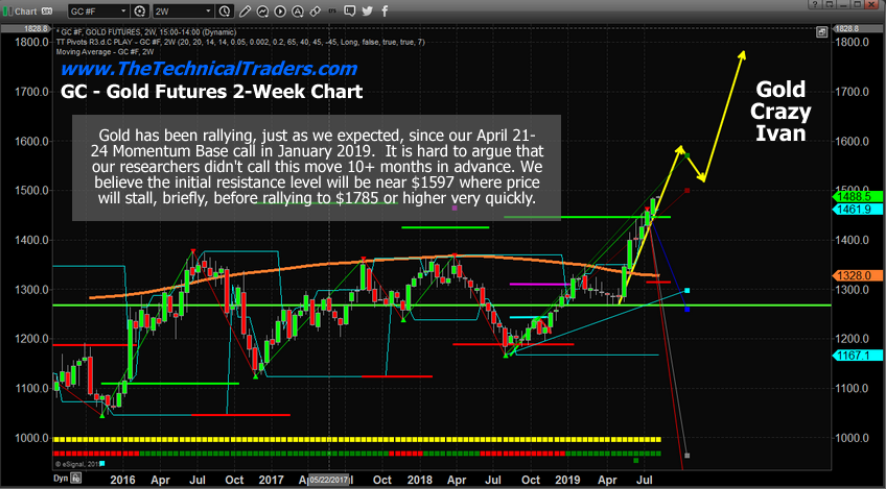
This first gold 2-Week chart highlights our Fibonacci price modeling tool and helps to show us where the price is targeting for the initial upside move from the April 21-24 Momentum Base pattern that we called back in January 2019. We believe the current breakout upside price move will initially target the $1597 level before briefly stalling, then rallying further to target the $1785 level or higher.
We believe the "Crazy Ivan" event could push gold much higher than our projected levels under certain circumstances:
A. The U.S. dollar weakens throughout the initial process of the event
B. Cryptos collapse as governments clamp down on rogue exchanges/currencies
C. Massive credit and debt issues arise in China, Asia or the EU that threaten future economic output and operations
D. Some type of crisis event unfolds where global investors believe war or conflict is imminent. (think Hong Kong, North Korea or somewhere in that general vicinity).
Without these additional impetuses in the metals market, we believe the price will follow our expectations (YELLOW LINES, below) fairly closely over the next 30 to 60+ days.

Silver's Daily Chart Interval
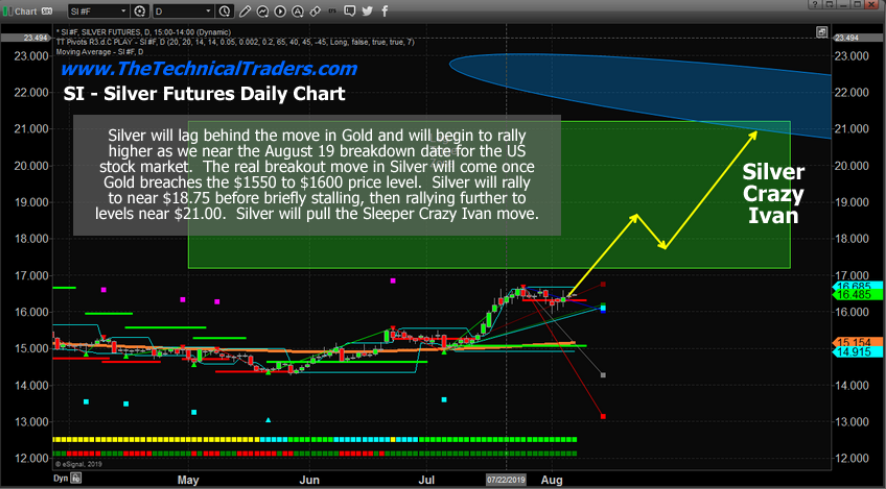
Silver, on the other hand, is set up to break substantially higher based on the upside move we expect in gold and the possibility that the Gold:Silver ratio will continue to contract to lower levels. Recently, the ratio fell from approximately 93 to 86. This move relates the total number of ounces of silver one must buy to equal the price of one ounce of gold. Currently, that level is back up to 89.5 as gold has rallied faster than silver.
But what happens when traders catch onto the fact that gold and silver will rally as this "Crazy Ivan" event takes place and that silver is the true undervalued metal across the planet? At the peak of gold and silver prices near April 2011, the Gold:Silver ratio was resting near 32 (yes, you read that correctly). What would that look like on the silver chart, below, if gold continued to rally to levels above $2000? It is really simple to find out.
$2000 (gold per ounce) / 32 = $62.50 per ounce of silver
What if gold rallied a full 100% Fibonacci measured move from the previous 1999-2011 rally? That peak level would be $2700 in gold and the calculation is still simple.
$2700 (estimate gold peak) / 32 = $84.375 per ounce of silver.
Could it happen like that? Yes, in theory, and in reality it really could happen that way if gold rallies to a level that equals a full 100% Fibonacci price extension and the ratio level falls to levels near 32. If that did happen, then these calculations would be accurate.
This is why we believe the "Crazy Ivan" event will become the catalyst for some incredible trading opportunities and big price swings over the next 6 to 13+ months.

Concluding Thoughts
Our $21 upside price target in silver is muted compared to our long-term price projections. Yet everything hinges on this August 19, 2019 breakdown cycle date and what happens after that. Our research suggests this current downside price move may have been a volatility explosion related to the lack of liquidity in global markets, hinting that the markets are capable of being far more irrational for far longer than anyone expects.
We are only 9 days into August and we have already closed out 24.16% in gains from the falling S&P 500 using SDS, and the pop in gold using UGLD, and from the oversold bounce and rally in silver miners SIL.
We urge all of our followers to pay attention to our research, consider your options closely and prepare for this next move by pulling some of your active portfolio away from risk and into more protective measures. This event is just 10 days away and we urge all of our followers not to underestimate this event cycle.
