MBIA Inc. (MBIA) together with its consolidated subsidiaries, operates the financial guarantee insurance businesses in the industry and is a provider of asset management advisory services.
This is a vol note – rising vol to be specific. News yesterday pushed the vol higher (above the historical measures). Let’s first check out the research note from yesterday:
MBIA (MBI: NYSE) By MKM Partners ($9.51, March 27, 2012)
We are initiating coverage of MBIA with a Buy rating and a 12-month price target of $18.
Our Buy rating is predicated on our belief that MBIA's (ticker: MBI) transformation litigation will either be upheld by the courts or see the remaining plaintiffs withdraw from the two primary cases challenging this transaction. If/when this occurs (and a separate case, Aurelius, is settled/dismissed), National Public Finance Guarantee (National) will become a separate entity […]
Source: Barron’s via Yahoo! Finance -- MBIA May See Catalyst Soon
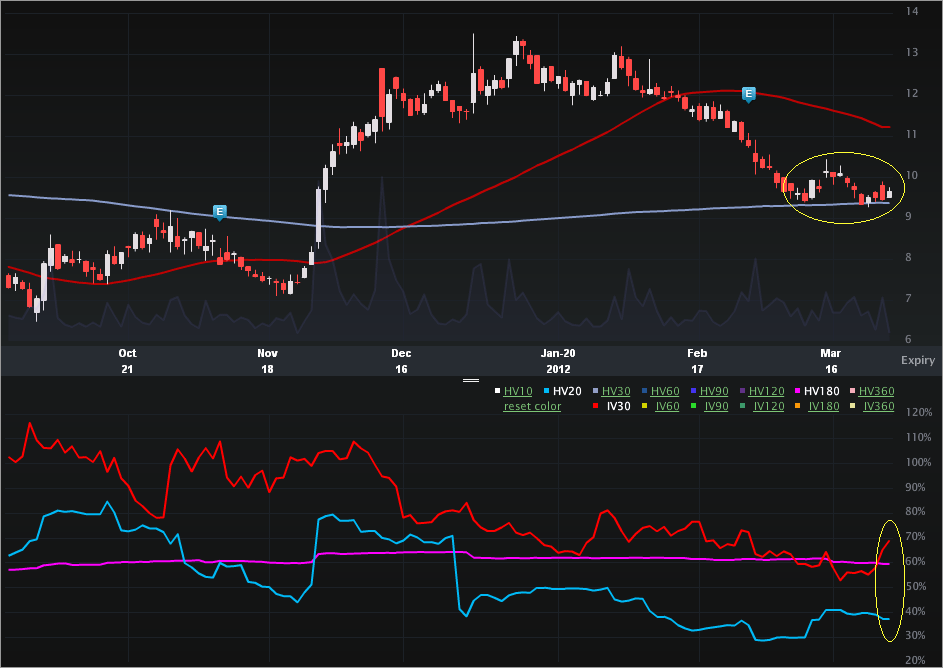
Just to be clear, the $18 price target is essentially a 100% higher target. Let’s turn to the Charts Tab (six months), below. The top portion is the stock price, the bottom is the vol (IV30™ - red vs HV20™ - blue vs HV180™ - pink).
On the stock side we can see a rather large move up between 11-26-2011 ($7.26) and 1-11-2012 ($13.32) of over 83%. The stock has come down off of those highs, and recently has found a sort of quit period with HV10™ at 35.77%.
On the vol side we can see a few interesting phenomena:
1. The implied has traded above the HV20™ and HV180™ for nearly all of the last six months other than a few days in the recent past.
2. The implied is now trading above both historical vol measures with the IV30™ pop today. The vol comps as of this writing are:
IV30™: 68.96%
HV20™: 37.54%
HV180™: 59.63%
3. Finally, while the implied has returned to its “standard” elevate level relative to the historical measures, it’s still depressed relative to its own history. The 52 wk range in IV30™ is [52.92%, 133.28%], putting the current level in the 19h percentile.
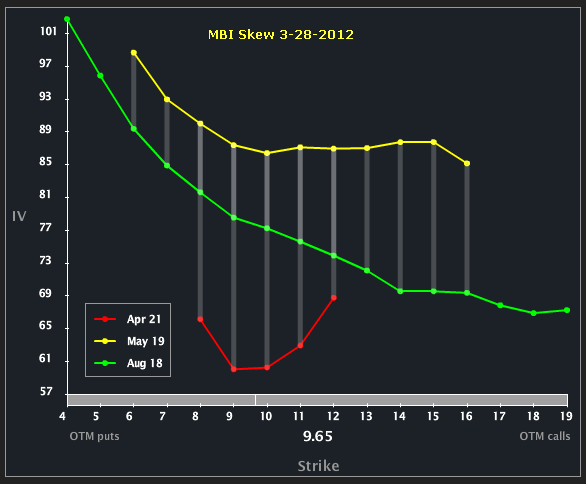
Let’s turn to the Skew Tab to examine month-to-month and line-by-line vols.
We can see that May is elevated to the other expiries and that’s due to the earnings release due out in the May cycle. Apr does show a parabolic shape reflecting tail risk in both directions in the near-term.
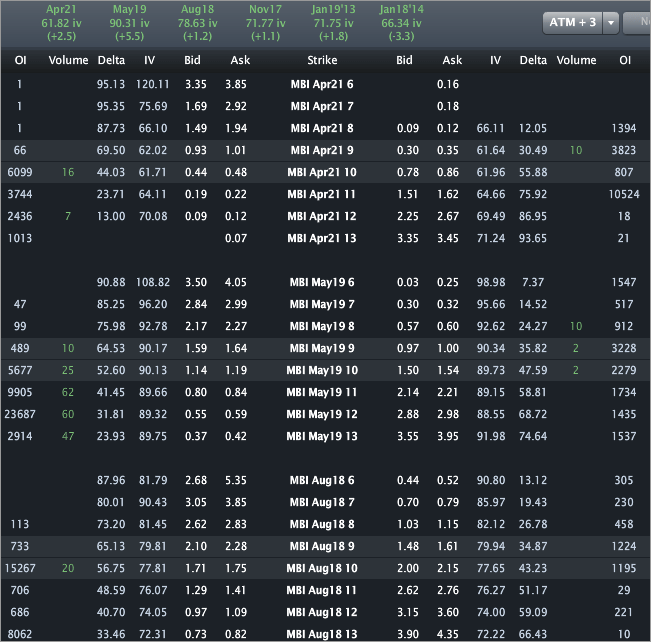
Finally, let’s turn to the Options Tab, for completeness.
I wrote about this one for TheStreet (OptionsProfits), so no specific trade analysis here. The vols across the top demonstrate 61.82%, 90.31% and 78.63% for Apr, May and Aug, respectively. This is a clear example where the earnings event has a huge impact on the reflected risk in the options. In English, the May vol is 50% higher than Apr.
This is trade analysis, not a recommendation.
- English (UK)
- English (India)
- English (Canada)
- English (Australia)
- English (South Africa)
- English (Philippines)
- English (Nigeria)
- Deutsch
- Español (España)
- Español (México)
- Français
- Italiano
- Nederlands
- Português (Portugal)
- Polski
- Português (Brasil)
- Русский
- Türkçe
- العربية
- Ελληνικά
- Svenska
- Suomi
- עברית
- 日本語
- 한국어
- 简体中文
- 繁體中文
- Bahasa Indonesia
- Bahasa Melayu
- ไทย
- Tiếng Việt
- हिंदी
MBIA Inc.: Earnings Vol Spikes, New Price Target For 100% Rise
Published 03/29/2012, 05:22 AM
Updated 07/09/2023, 06:31 AM
MBIA Inc.: Earnings Vol Spikes, New Price Target For 100% Rise
3rd party Ad. Not an offer or recommendation by Investing.com. See disclosure here or
remove ads
.
Latest comments
Install Our App
Risk Disclosure: Trading in financial instruments and/or cryptocurrencies involves high risks including the risk of losing some, or all, of your investment amount, and may not be suitable for all investors. Prices of cryptocurrencies are extremely volatile and may be affected by external factors such as financial, regulatory or political events. Trading on margin increases the financial risks.
Before deciding to trade in financial instrument or cryptocurrencies you should be fully informed of the risks and costs associated with trading the financial markets, carefully consider your investment objectives, level of experience, and risk appetite, and seek professional advice where needed.
Fusion Media would like to remind you that the data contained in this website is not necessarily real-time nor accurate. The data and prices on the website are not necessarily provided by any market or exchange, but may be provided by market makers, and so prices may not be accurate and may differ from the actual price at any given market, meaning prices are indicative and not appropriate for trading purposes. Fusion Media and any provider of the data contained in this website will not accept liability for any loss or damage as a result of your trading, or your reliance on the information contained within this website.
It is prohibited to use, store, reproduce, display, modify, transmit or distribute the data contained in this website without the explicit prior written permission of Fusion Media and/or the data provider. All intellectual property rights are reserved by the providers and/or the exchange providing the data contained in this website.
Fusion Media may be compensated by the advertisers that appear on the website, based on your interaction with the advertisements or advertisers.
© 2007-2024 - Fusion Media Limited. All Rights Reserved.
