This picture is exactly what I do not want to see as the stock market struggles to hold critical technical supports: a major index of economically-sensitive stocks confirming a breakdown of support at its 200-day moving average (DMA). The Materials Select Sector SPDR ETF (NYSE:XLB) lost 1.3% on a day when the S&P 500 (via SPDR S&P 500 (NYSE:SPY)) only lost 0.3%. XLB also closed at a 5+ month low which added more confirmation to its bearish breakdown below its 200DMA. This picture is particularly troubling on a day when the Bureau of Economic Analysis (BEA) revised its estimate for U.S. fourth quarter annual GDP growth UPWARD from 2.5% to 2.9%. Investors did not seem to care and instead looked ahead to some future troubles.
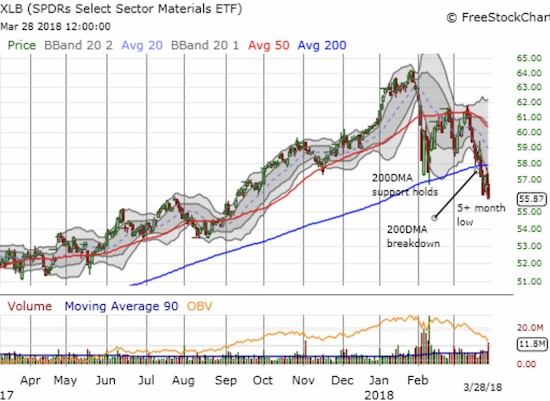
The Materials Select Sector SPDR ETF (XLB) has declined 11 out of the last 13 days after confirming resistance at its 50DMA. The new 5+ month low further confirms a bearish 200DMA breakdown.
This trading action forced me out of a position in Vulcan Materials (NYSE:VMC). For too long I watched profits evaporate in this sell-off. VMC broke down twice below its 200DMA and for good measure confirmed its 200DMA as resistance.
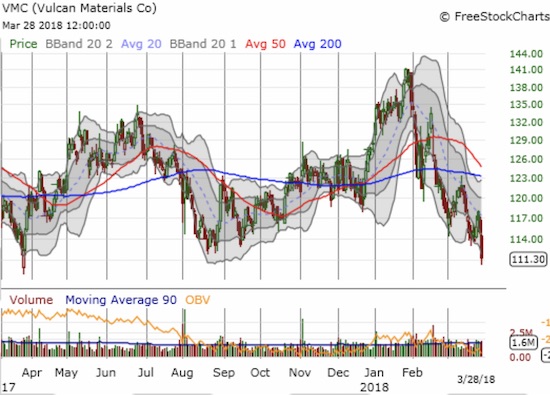
Vulcan Materials (VMC) lost 3.0%. The stock has not closed this low since October, 2016.
For good measure, I sold a long-standing holding in infrastructure play Fluor Corporation (NYSE:FLR). The stock made a fantastic recovery since an 8-year low in August of last year. I am glad I accumulated shares in the sell-off. However, the bearishness in materials made me eager to lock in profits on a company that helps move a LOT of materials.
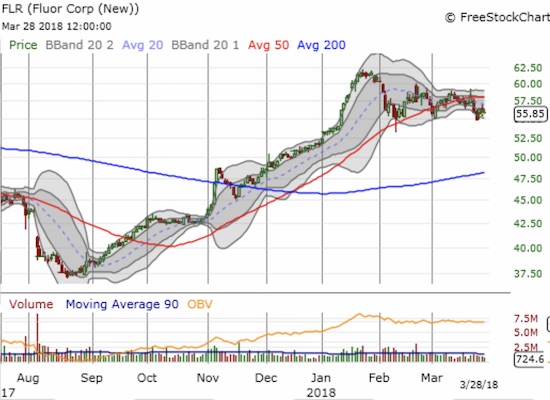
Fluor (FLR) topped out with the market in late January and is trying to hold support around the February low. For now, 50DMA resistance is the more dominant theme.
Allegheny Technologies Incorporated (NYSE:ATI) deals in specialty materials. At an 11.3 forward P/E, 0.8 price/sales ratio, and a 1.7 price/book ratio, I think of this stock as a very cheap play on a strong global economy. I was looking to buy the stock here around its 200DMA, but the further breakdown in XLB put a pause on my plans. I am now staying on the sidelines to watch some more.
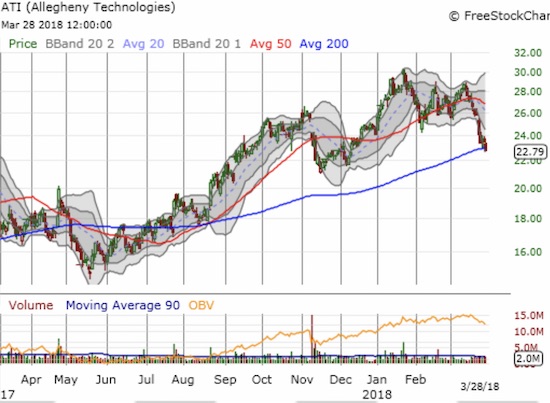
Allegheny Technologies Incorporated (ATI) ducked under its 200DMA with a 2.4% loss on the day. The stock looks vulnerable enough to challenge November’s low.
U S Concrete Inc (NASDAQ:USCR) is a stock where materials, infrastructure, and a strong economy all converge in one place. I want to use the current sell-off as a buying opportunity, but the stock’s weakness has been relentless. On Wednesday, USCR lost a whopping 4.1%. The stock is well below its 50 and 200DMAs and looks ready to test the bottom of a trading channel from the first half of 2017. I interviewed CEO Bill Sandbrook last August and received some great insight on the bullish story supporting USCR. I hope to talk to him again soon to get a better understanding of the current weakness, especially since earnings on March 1st.
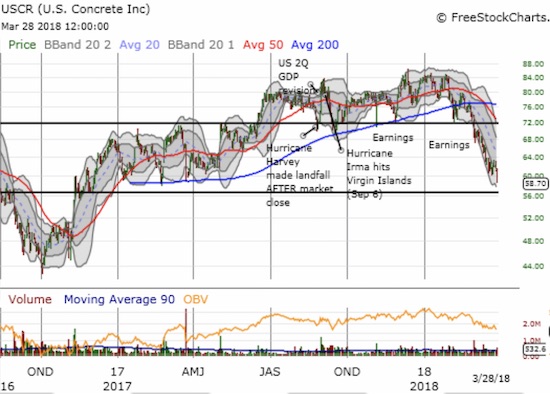
U.S. Concrete (USCR) reported earnings in the middle of severe market weakness. The market has been ever more unforgiving ever since.
Be careful out there!
Full disclosure: long SPY shares and calls
