
MasTec, Inc. (NYSE:MTZ) reported record third-quarter 2017 adjusted earnings per share of 82 cents, beating the Zacks Consensus Estimate of 74 cents. Earnings also improved 1.2% year over year.
Including one-time items, MasTec reported earnings of 77 cents per share compared to 69 cents reported in the prior-year quarter.
Operational Update
MasTec’s net sales climbed 23% year over year to a record $1.96 billion in the quarter, handily outpacing the Zacks Consensus Estimate of $1.65 billion. The Oil and Gas segment’s revenues in the reported quarter surged a whopping 57.7% to $1.16 billion over the third-quarter 2016 level.
MasTec, Inc. Price, Consensus and EPS Surprise
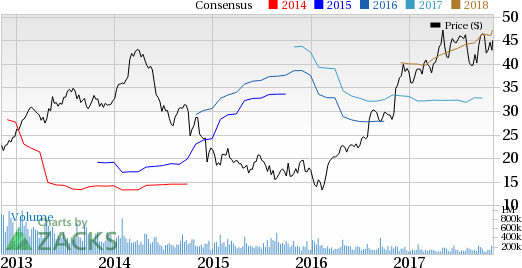
MasTec, Inc. Price, Consensus and EPS Surprise | MasTec, Inc. Quote
However, revenues at the Power Generation and Industrial segment declined 21.6% year over year to $96.9 million. The Electrical Transmission segment also recorded a 20% fall to $81.8 million in revenues. In addition to this, the Communication segment’s revenues dropped 2.2% year over year to $610.5 million.
Cost of sales in the quarter jumped 26% year over year to $1.73 billion. Gross profit was up 5.7% to $229.6 million from $217.2 million recorded in the prior-year quarter. Gross margin contracted 200 basis points to 11.7% in the third quarter.
General and administrative expenses went down 1.1% to $66.4 million. MasTec reported operating profit of $113.1 million in the quarter, up from $107.5 million reported in the year-earlier quarter. Adjusted earnings before interest, taxes, depreciation and amortization (EBITDA) increased to $179.6 million compared with $164.8 million witnessed in the comparable quarter last year.
Financial Details
MasTec reported cash and cash equivalents of $43.8 million as of Sep 30, 2017, considerably up from $9.4 million as of Sep 30, 2016. The company recorded cash from operations of $178.6 million for the nine-month period ended Sep 30, 2017 compared with $127 million recorded in the comparable year-ago period. Long-term debt was $1.19 billion as of Sep 30, 2017, compared with $961 million as of Dec 31, 2016.
Guidance
MasTec is poised to gain from significant amounts of project awards across multiple segments. The company projects its 2017 backlog to be at record levels, exceeding $6 billion, with increasing demand and backlog growth across all segments. It believes strong cash flow, solid capital structure and ample liquidity will provide financial flexibility to support significant growth opportunities.
Buoyed by these factors, MasTec raised its 2017 guidance to record levels. The company now projects 2017 annual revenues of nearly $6.3 billion, up from the prior guidance of $6 billion. It has guided adjusted earnings per share of $2.80 higher than the previous guidance of $2.73 for the current year. This again marks a remarkable surge of 47% over the prior-year levels. Additionally, MasTec estimates adjusted EBITDA to jump 32% to $630 million, up from the earlier projection of $620 million.
Further, for fourth-quarter 2017, MasTec guided revenues to be roughly $1.3 billion. The company anticipates adjusted EBITDA of around $113 million and adjusted earnings per share of 36 cents for the next quarter.
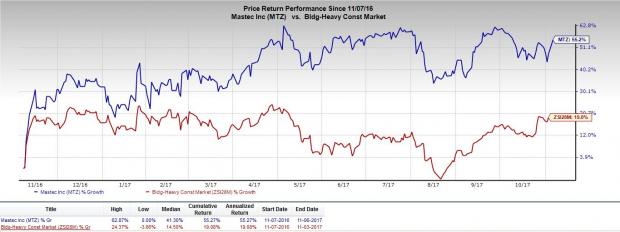
Share Price Performance
In the last year, MasTec has significantly outperformed the industry with respect to price performance. The stock has gained around 55%, while the industry recorded growth of 19%.
Zacks Rank & Other Key Picks
MasTec currently carries a Zacks Rank #2 (Buy).
Other top-ranked stocks in the same sector are EMCOR Group, Inc. (NYSE:EME) , Sterling Construction Company, Inc. (NASDAQ:STRL) and Louisiana-Pacific Corp. (NYSE:LPX) . All three stocks flaunt a Zacks Rank of #1 (Strong Buy). You can see the complete list of today’s Zacks #1 Rank stocks here.
EMCOR has an expected long-term earnings growth rate of 15%.
Sterling Construction has an expected long-term earnings growth rate of 11%.
Louisiana-Pacific has an expected long-term earnings growth rate of 5%.
Zacks' Hidden Trades
While we share many recommendations and ideas with the public, certain moves are hidden from everyone but selected members of our portfolio services. Would you like to peek behind the curtain today and view them?
Starting now, for the next month, I invite you to follow all Zacks' private buys and sells in real time from value to momentum...from stocks under $10 to ETF to option movers...from insider trades to companies that are about to report positive earnings surprises (we've called them with 80%+ accuracy). You can even look inside portfolios so exclusive that they are normally closed to new investors.
Click here for Zacks' secret trade>>
Louisiana-Pacific Corporation (LPX): Free Stock Analysis Report
EMCOR Group, Inc. (EME): Free Stock Analysis Report
MasTec, Inc. (MTZ): Free Stock Analysis Report
Sterling Construction Company Inc (STRL): Free Stock Analysis Report
Original post
Zacks Investment Research