- A Dark Cloud Cover pattern is a Japanese Candlestick Pattern that is typically associated with major top setups.
- Critical Support on the SPY highlighted by multiple technical analysis strategies suggests 335~335.25 is acting as a major support level.
- If price stays below the $339.95 level, then we interpret the trend as being Bearish. If price moves above the $343.55 level, it is Bullish.
Critical Support on the SPDR S&P 500 (NYSE:SPY) highlighted by multiple technical analysis strategies suggests 335~335.25 is acting as a major support level. The rally in the markets that started late Sunday and carried forward into early trading on Monday, Sept. 28, 2020, suggests the market is attempting to rally above this support level to establish a potential momentum base. My advanced price modeling systems and Fibonacci Price Amplitude Arcs (originating from the 2009 bottom) have clearly identified this area as a critical resistance/support zone.
Monthly Dark Cloud Pattern May Be Calling The Top
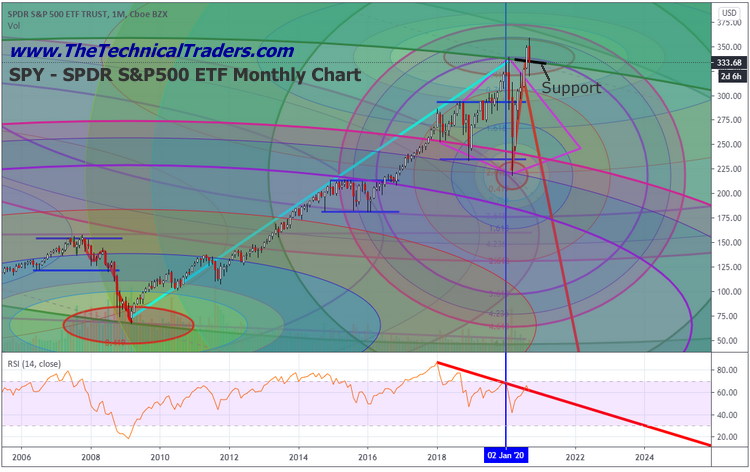
The first chart below highlights the SPY Monthly chart data and shows the recent peak in price that broke through the major resistance level near 335, then collapsed back below that same level. Prior to this recent collapse, the COVID-19 peak in February also briefly touched this same resistance level–confirming it as valid. We believe the current price activity suggests the markets are attempting to form some sort of price base above this $335 level on the SPY.

As you can see from the recent highs on the chart above, there is a new Fibonacci Price Amplitude Arc range set up by the COVID-19 collapse that may interrupt this Base Setup process. Look for the smaller OBLIQUE on the chart near where the word “Support” is. This is a new Fibonacci Price Amplitude Arc that reflects the most recent price range activity into targeted Fibonacci based price zones.
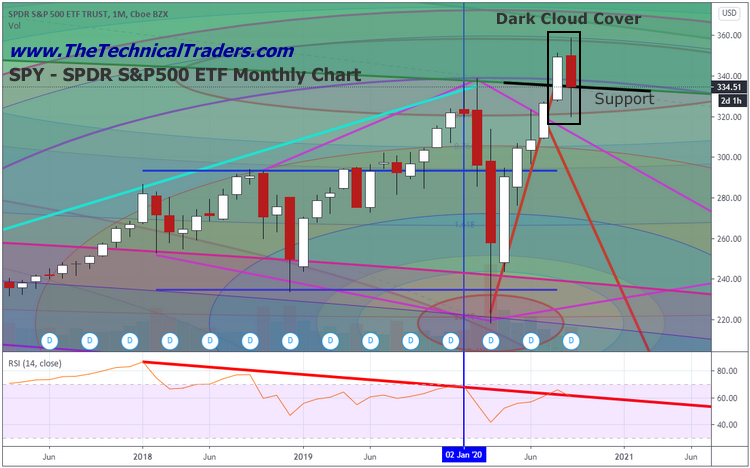
If the SPY price falls below the $322 level of the current lower Arc, then the markets will appear to be attempting to break lower. If the SPY price rallies above the $357.50 level, then the markets will appear to be attempting to break higher. The current monthly price bar spans the total height of this new Fibonacci Price Amplitude Arc – thus it is suggesting a volatile type of topping pattern is setting up. If today was the last trading day of the month, this Monthly chart pattern would set up a very large Dark Cloud Cover pattern – a major topping pattern.
A Dark Cloud Cover pattern is a Japanese Candlestick Pattern that is typically associated with major top setups. It represents a clear change in trend direction when a new “Filled” (RED) candle opens above the previous “Empty” (WHITE) candle’s closing price and the “Filled” candle closes below the midpoint of the “Empty” candle’s body. In the chart below, the size of the pattern is very relevant because it is setting up near a major price peak after volatility has increased to nearly 2x or 3x normal volatility ranges. This pattern is a classic topping formation pattern and we’ll have to see how the next few trading days play out.

If the SPY price is able to rally above the $339 price level, then this pattern changes into an Incomplete Dark Cloud Cover pattern–waiting for a breakdown technical confirmation in price to confirm a major top setup. If the SPY price stays below the $339 level, then this pattern stays a Dark Cloud Cover pattern which would still require technical confirmation–but become much more ominous related to the bigger “monthly” picture for the US stock market. It becomes an even scarier pattern when you consider we are just weeks away from a Presidential election event.
When we pair this research with our Adaptive Fibonacci Price Modeling system, it become clear there are two major levels we should all be watching on the SPY charts. The first is the Bearish Fibonacci Price Trigger level near $339.95 and the second is the Bullish Fibonacci Price Trigger Level near $343.55. With such a narrow range between these two trigger levels, we interpret the range between them as “neutral”. If price stays below the $339.95 level, then we interpret the trend as being Bearish. If price moves above the $343.55 level, then we interpret the trend as being Bullish.
We urge you to pay attention to how these levels align together across different types of Fibonacci price analysis/modeling. When this happens, we believe our modeling systems are pinpointing very accurate trigger price levels that become major support/resistance areas on the charts.
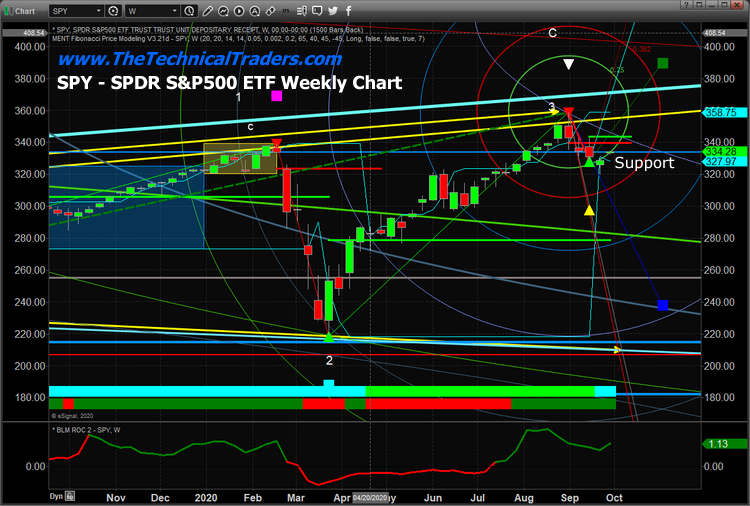
You’ll also notice the various Arcing levels on this Weekly SPY chart (below) that represent our Fibonacci Price Amplitude Arcs on a Weekly chart basis. Clearly, there is a GREEN ARC very near the current support level and current price level on the SPY. This GREEN ARC is the most immediate support zone on the SPY. If this level is breached to the downside, then we will immediately target the $310 or $280 level as prices collapse.

Our previous modeling system support suggests the $334.25 level as support. Taken all together, we have a bunch of support levels above $334 and a bunch of resistance levels above $343. With the current Dark Cloud Cover setup, we believe the markets are poised for an attempted downside price move—a big breakdown is possible if $334 does not hold. We will need to see the $339 and $334 levels hold over the next few weeks in order for the SPY to move higher. These Fibonacci Price Amplitude Arcs are suggesting major price volatility is pending. The Dark Cloud Cover on the Monthly chart suggests a big ominous topping pattern has setup. It’s pretty clear to see that we could be in for a big breakdown in price if these support levels are breached.
Stay safe. Avoid risky positions if you can. This move could unload to the downside in a hurry. Remember, the SPY price must stay above $334 to stay somewhat Bullish—and even then we are not completely safe from a big breakdown in the markets. Unless the SPY rallies above $351 before the end of this month, some type of major topping Japanese Candlestick Pattern will setup.
