In contrast to some of its immediate peers, Marshall Motor Holdings PLC (LON:MMHM) continues to deliver robust performances in even more challenging UK car markets. Increased revenues and gross profit, with gross margins maintained at 11.4%, limited the fall in H119 PBT to just £0.8m or 5% compared to H118, allowing for the restatement for adoption of IFRS 16. We maintain our underlying PBT estimates for FY19, which are reduced by the non-cash impact from the implementation to IFRS 16 by around 3.6%. We feel recent price weakness was due to company-specific issues at peers. While MMH may be facing a plateau in profitability as UK car markets await clearer economic signals, we feel the yield is supportive while investors await any improvement in fundamentals for the automotive retail sector overall.

Resilient H119 performance
MMH’s H119 performance in still challenging markets proved very resilient, especially compared to pressures seen by peers in Q219 used car markets in recent trading updates. MMH again outperformed both new and used markets. The cash performance was also better than expected as highlighted in the July trading update, with period-end adjusted net cash of £5.8m (before lease liabilities). Despite weakness in new car markets and Q219 used car residual value declines, group revenues were up 1.8% and gross margin was maintained at 11.4%. Cost pressure continues to be mitigated by management, which limited the decline in PBT to just £0.8m. Adopting IFRS 16 for lease accounting dilutes PBT by c 4% at the half year and for FY19 but is a presentational adjustment with no cash impact.
Peering through the Brexit clouds
The automotive retail outlook remains uncertain primarily due to the overhang on buyer sentiment until the Brexit situation is clarified. Other factors could constrain H219 new car sales such as another round of emissions testing regime changes for manufacturers to manage, which had a significant effect on the supply of certain models in H218. However, given the nature of current year changes and the expected stabilisation of used car selling volumes, H219 may see some modest market improvements.
Valuation: Multiple contraction appears overdone
The yield of 6.1% remains supported by the strong balance sheet, with a NAV of 257p per share and net cash. With the continued resilience of earnings, the FY20 P/E rating in already depressed demand environment of 5.8x looks undemanding.
Business description
Marshall Motor Holdings is the seventh-largest UK motor retailer, operating 101 franchises spread across 22 brands at 89 locations. It is one of six UK dealership groups that represent each of the top five volume and premium brands. The group has a strong presence in eastern and southern England.
Interim results and outlook
MMH delivered a robust performance in H119, with a modest fall in PBT despite the continuing pressures in new car markets and the residual value declines in used car markets that progressively increased through Q219. In unit terms all three retail segments outperformed the market. As foreshadowed in the recent trading update, the company once again delivered a better than expected cash flow, with period end net cash of £5.8m. That is before the IFRS 16 introduction of capitalised operating lease liabilities to the balance sheet totalling £88.0m at the end of H119. These are largely offset on the balance sheet by the associated capitalised right of use asset, which stood at £83.3m at H119. As MMH sold its vehicle leasing business in December 2017, the assets involved are primarily leaseholds relating to dealership properties.
The accounting change does not affect cash flows or debt covenants but does lead to a modest reduction in net assets. In addition, due to the recent high levels of investment to improve many sites held on leasehold, the level of depreciation incurred against the right of use assets and interest charge against the capitalised liabilities are larger than the historic rental cost that would have been charged to the P&L under the previous accounting rules. As a result, there is a modest 4% reduction in underlying profit before tax expected for FY19 resulting from adoption of the new standard. The net asset value per share improved to 257p from 215p a year previously, adjusted for IFRS16.
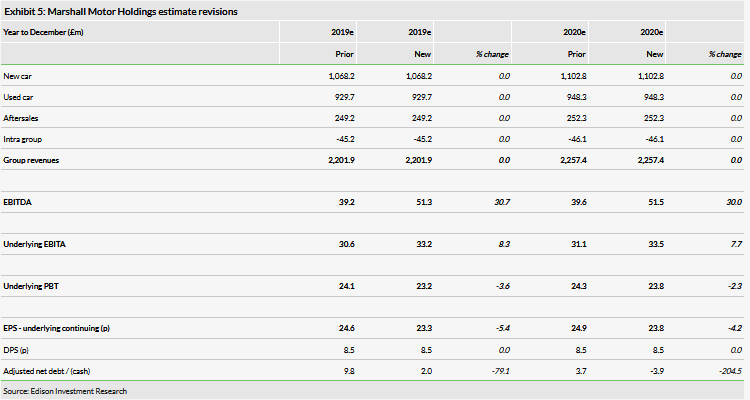
Our underlying estimates for FY19 and FY20 remain unchanged save for this non-cash accounting transition. There is an anticipated decline in underlying PBT in FY19 compared to FY18, but this is as previously forecast and similarly we continue to forecast a small improvement in FY20.

Management also increased the interim dividend by 32.6% to 2.85p (H118 2.15p). We believe the increase mainly reflects a rebalancing exercise following the recent revision to the dividend policy. We currently expect the full year dividend to be unchanged.

Group revenues rose by 1.8% despite the continued challenges in the new car market, which were compounded by the progressive weakening of residual values for used car activities during Q219. Normal seasonal weakness appears to have been aggravated by some destocking efforts amongst peers.
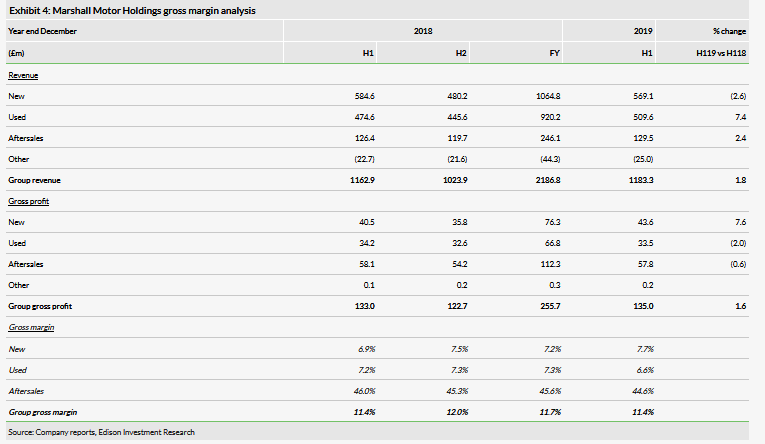
As shown in Exhibit 4, group gross margins were maintained at 11.4% reflecting a strong performance in the new car segment despite the market pressures, offsetting the margin pressures in used cars that increased as Q219 progressed and a continued decline in the high margin aftersales business. Gross margins rose 80bp in the new car business to 7.7%. Overall the H119 gross profit contribution rose 1.6% to £135.0m (H118 £133.0m), a commendable performance given the unhelpful market backdrop in the period.

On an underlying basis, operating costs represented 9.7% of revenues compared to 9.6% in H118. On a like-for-like basis operating expenses were up 1.6%, compared to a like-for-like revenue increase of 0.9% with several management actions helping to control the persistent cost headwinds.
In new cars a decline in sales to retail customers of just 0.4% on a like-for-like basis (an actual increase of 1.9% to 16,108 vehicles (H118 15,803)) compared to a market decline of 3.2% in the period. Similarly, fleet unit sales in the new car segment fell by 1.1% on a like-for-like basis (actual decline 2.1%) to 9,199 vehicles (H118 9,396), compared to a UK market decline of 3.6%.
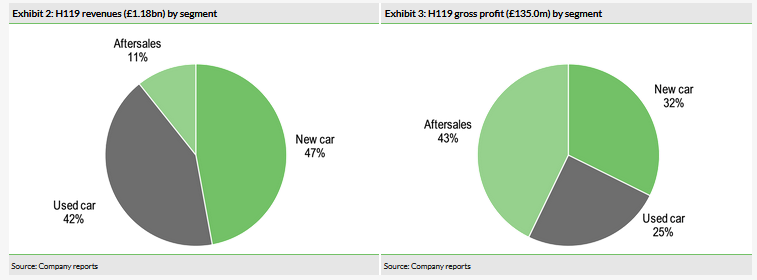
There was a very strong outperformance once again in used car unit sales, which grew 6.8% on a like-for-like basis and an overall 7.4% to £509.6m (H118 £474.6m), representing 42% of group revenues. Unit sales were 7.4% higher at 24,330 (H118 22,659) vehicles, up 7.2% on a like-for-like basis. After a strong start to the year, margins came under pressure during Q219 as residual values fell by around 10%. The result was a 60bp decline in gross margin for the activity to 6.6%. Management’s tight control of inventory levels seems to have insulated it from some of the damage experienced by peers resulting from the fall in selling prices.
It should be noted that while MMH faces the same regulatory requirements as all other dealer groups for certain product sales and financing deals, it does not appear to be facing any abnormal developments from a compliance perspective.
Aftersales services, including bodyshop, continued to show consistent growth with revenues of £129.5m up 2.4% on H118 (£126.7m) or 1.8% like for like. Aftersales accounts for just 11% of group revenues, but the gross profit contribution of £57.8m represents 43% of the group total. The contribution was a modest 0.6% lower than in the comparable period as gross margins dipped to 44.6% (H118 46.0%), The margin pressure partly reflected an increased mix of lower-margin parts sales, which also faced some pricing pressure compared to the highly profitable service activity where there were also some cost headwinds. Over 70,00 customers are in live service plans with MMH, which greatly assists retention and future visibility in this very high-margin segment. Management expects aftersales margins to experience some recovery in H219.
UK car market prospects remain in the Brexit doldrums
The labour market fundamentals and the low interest environment remain supportive for car markets. However, consumer and business confidence continues to be undermined by the uncertainty created by the Brexit debacle, now compounded by political concerns over a potential general election. Of course the outcomes for these factors could be positive for car retailers, but the lack of any certainty does not permit optimism at present. Weaker used car selling values in Q2 may prove to have been a transient period as competitors unwound overstocked situations, but again this is unlikely to settle down until H219 develops. A further round of Worldwide Harmonised Light Vehicle Test Procedure (WLTP) emissions testing regime introduction for commercial vehicles on 1 September 2019, which coincides with the start of the Real Driving Emissions Test for cars could lead to further supply side disruptions in H219. The impact of last year’s changes was marked in Q318 and Q418 and although it is expected to be less disruptive in H219, it could still constrain new vehicle sales volumes.
The SMMT new car registration forecast for 2019 has been trimmed once again in its latest July forecast with the decline now expected to be 2.2% compared to the April forecast, which anticipated a 1.6% fall. The forecast is derived from the average consensus of a panel of forecasters and is now for a decline of 2.2% to 2.316m units from 2.367m in 2018. A further 1.2% decline is anticipated in 2020. New light commercial vehicle (van) sales are expected to rise by 1.4% to 0.363m vehicles this year then fall by 6.4% in 2020. Both car and van sales remain at healthy levels in historical terms. Diesel cars’ share of the new car market continues to fall sharply with a further 17.2% decline in sales volumes expected in 2019, taking diesel engine vehicles’ share of the new car market down to just 27% compared to 47.7% in 2016 and a peak of 50.8% in 2012.
The implication of the forecast is that the new car market will improve during H219 following last year’s WLTP disruption. However, July has shown a larger decline in registrations than was seen in H119, so this remains far from a given. While lower, the used car market continues to remain relatively stable in volume terms, but it is residual value pressures that have been affecting margins, which we expect to stabilise in H219. The overall picture again remains clouded by Brexit, although new vehicle supply-side shortages could be a positive as could the possible stabilisation of selling values as apparent destocking programmes by some peers complete. The high margin aftersales activity is expected to continue to grow, supported by the large number of cars financed on personal contract plans (PCPs) that require service histories to be maintained.
PBT estimates unchanged
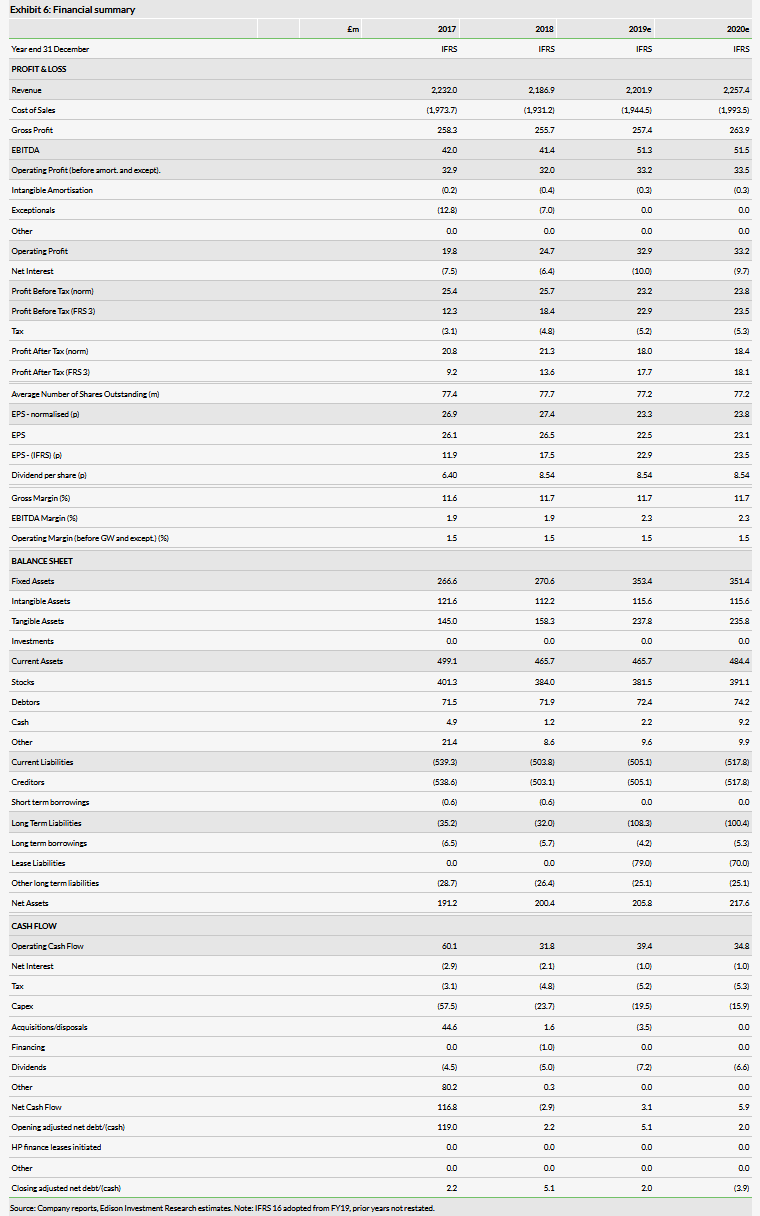
Essentially our trading estimates are unchanged with the PBT only affected by the transition to IFRS 16 accounting for leases, which reduces the estimates by 3.6% or £0.9m, all of which is a non-cash effect. Earnings per share are further diluted by around 1.8% as we now assume a tax charge of 22.5% compared to 21% previously. More positively the adjusted net cash performance in 2019 looks set to be more favourable than we had assumed and we expect adjusted net debt at the year end to be just £2.0m.


Despite the increase in the interim dividend, we do not expect an overall increase for the full year as we see this as restoring the more normal split between the interim and the final. In FY18 the interim dividend was held but the final was increased significantly as the pay-out ratio was improved by the company in line with its recently revised dividend cover policy for full-year dividends to be covered between 2.5x to 3.5x underlying earnings (previously 4–5x).