In this past weekend's missive, I discussed the recent issuance of an "initial" weekly SELLsignal for the S&P 500 and reviewed the major sectors of the market. I also stated that the market was oversold enough for a bounce with which to rebalance portfolios into. This morning the markets are once again violating previous support levels which has triggered additional selling.
I have discussed previously that as we enter into the 6th year of the current bull market cycle many of the fundamental arguments have fallen to the wayside. Valuations are no longer cheap, interest rates have risen and the retail investor is no longer on the sideline. (Click here to see relevant charts) I also recently discussed the shear magnitude of the current market cycle in terms of percentage gains as well as the length of the current economic expansion.
With the statistical and fundamental underpinnings being slowly stripped away, much of the current market environment has been a function of price momentum and investor optimism. The surge in the markets over the last couple of months in particular have reached extremes. The most pressing question right now is whether the current "cyclical bull market" is over, or is this another blip within the current bullish trend?
(Note: I primarily use weekly data to smooth the volatility of the charts to reveal the underlying trends to lower portfolio churn.)
First, the current correction is much like the previous spats of selling that we have witnessed over the last couple of years. One thing to note is that the corrections, on a weekly basis, have continued to become shallower as investors have become more complacent about overall market risk. This is an unsustainable trend in the long term.
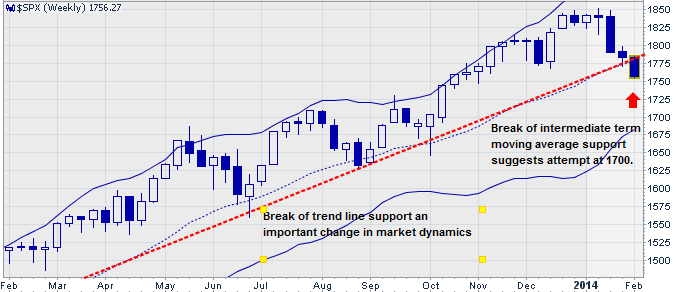
Secondly, while the market is currently breaking its intermediate term moving average, which is historically a sign of a bigger correction, the interventions by the Federal Reserve have provided an "artificial" support to prices. The last three breaks, which should have been resolved by a fall in prices to the lower 2-standard deviation band, quickly reversed as liquidity was pushed into the system.
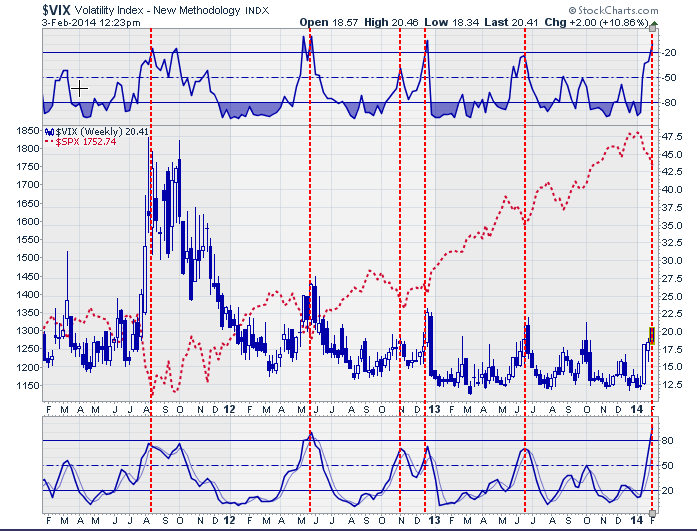
The volatility index, as a measure of investor complacency, has surged over the last week to levels that have been previously consistent with at least a short term market bottom.
However, while those charts suggest that the current correction process may be in for a short term reversal, the following charts suggest that a much bigger consolidation/correction may be in the works.
The chart below shows the S&P 500 index from the 2009 lows to present. The rise in the market has been well contained by the two primary trend lines. However, with the introduction of the Federal Reserve's latest monetary program at the end of 2012, prices elevated sharply during 2013. The recent sell off has now broken that upward bullish trend line.
Furthermore, the current overbought condition of the market (as shown by the top part of the chart below) suggests that the current correction process is yet to be complete.
My "best guess" is that the market is getting fairly washed out in the short term and will like muster a rally over the next few days. As I wrote in this past weekend's missive individuals should take action with regards to their allocation models:
- Sell “laggards” and “losers” in FULL. These are positions that have performed very poorly relative to the markets. Positions that are out of favor on the run up – generally tend to fall faster in declines.
- Trim positions that are big winners in your portfolio back to their original portfolio weightings. (ie. Take profits)
- Positions that performed with the market also reduce back to original portfolio weights.
- Move trailing stop losses up to new levels.
- Review your portfolio allocation relative to your risk tolerance.
I can only guess what the next few days will hold for the markets, but the current rout is getting a bit extreme in the short term. While I am suggesting that you may want to review your current allocation model and take some actions; it is critically important NOT to do so from a position of "panic." Pragmatic decision making always leads to the best results. History can only tell what has happened under similar circumstances in the past - it is not a prediction of the future.
If you want to be a better investor, then you need to do what great investors do. Every great investor of our time have all followed very simple, repeatable, definable, and actionable rules to manage both portfolio risk and a buy/sell discipline.
Ray Dalio summed it up best by stating:
"The biggest mistake investors make is to believe that what happened in the recent past is likely to persist. They assume that something that was a good investment in the recent past is still a good investment. Typically, high past returns simply imply that an asset has become more expensive and is a poorer, not better, investment."


